|
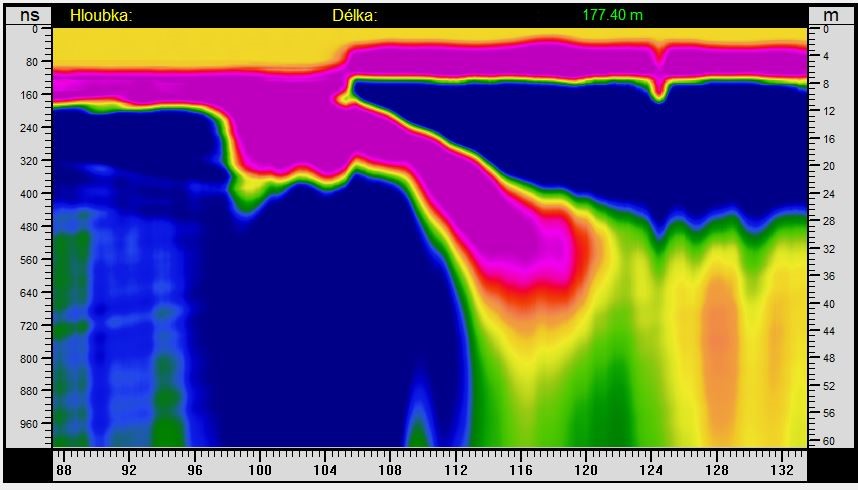
Surface water to shallow depths. Where the red area is stretched down, we can assume a crack that is sealed at the bottom, so the water does not penetrate deeper into the subsoil or very little.
Here the water penetrates a crack to the right down and disperses. It is possible that a yellow-green color at the bottom right shows another type of rock, more permeable to water.
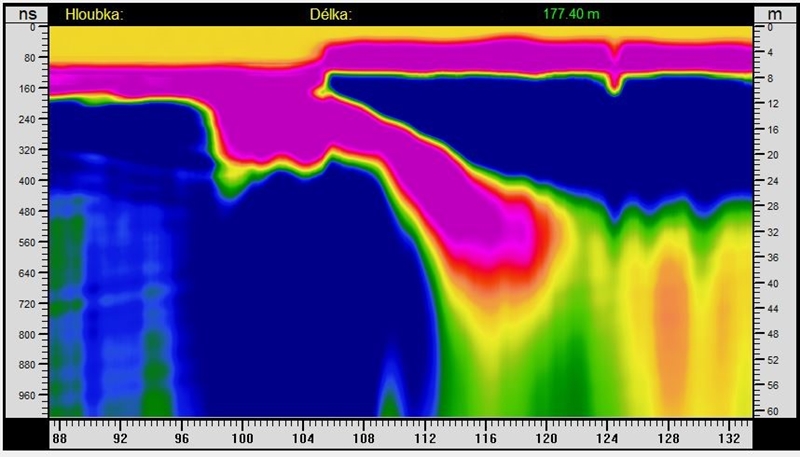
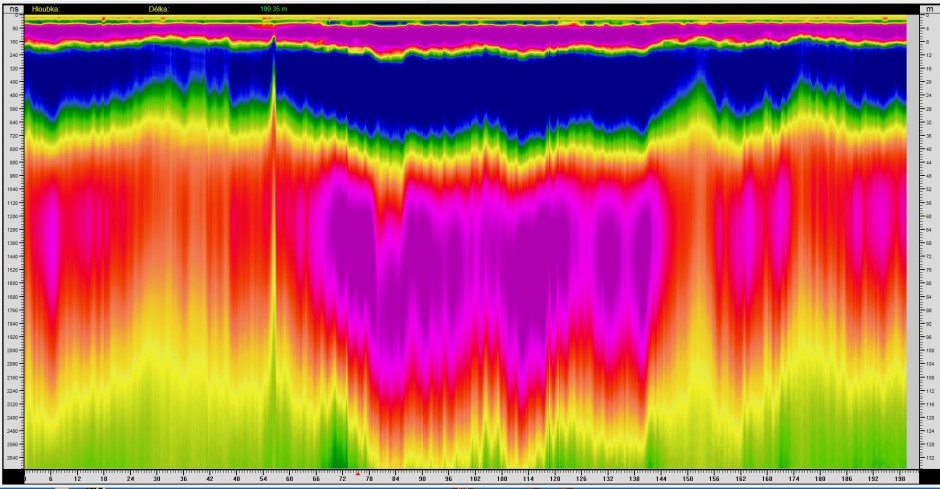
Profile measured at Radlice, clay and limestone. Here we see layers of surface water at the top, an impermeable layer at a depth of about 70 m and a crack at a distance of 125 m. The crack holds water at a depth of 110 to 180 m. Georadar can’t tell us how much water is in the anomalies found. It only informs us about where is the most water on the measured profile.
The break (shift) in which water is held can reach depths of hundreds of meters.
It can be seen on some radargrams that the lower part of the red areas is typically elongated. This is called a low frequency tail. It arises because due to the high conductivity, the shape of the transmitted pulse changes, which passes through an environment with high permittivity or conductivity, the pulse stretches and it deforms the reflected wave. So we can determine the beginning of a zone with good accuracy, but it can be worse if we have to determine its lower boundary.
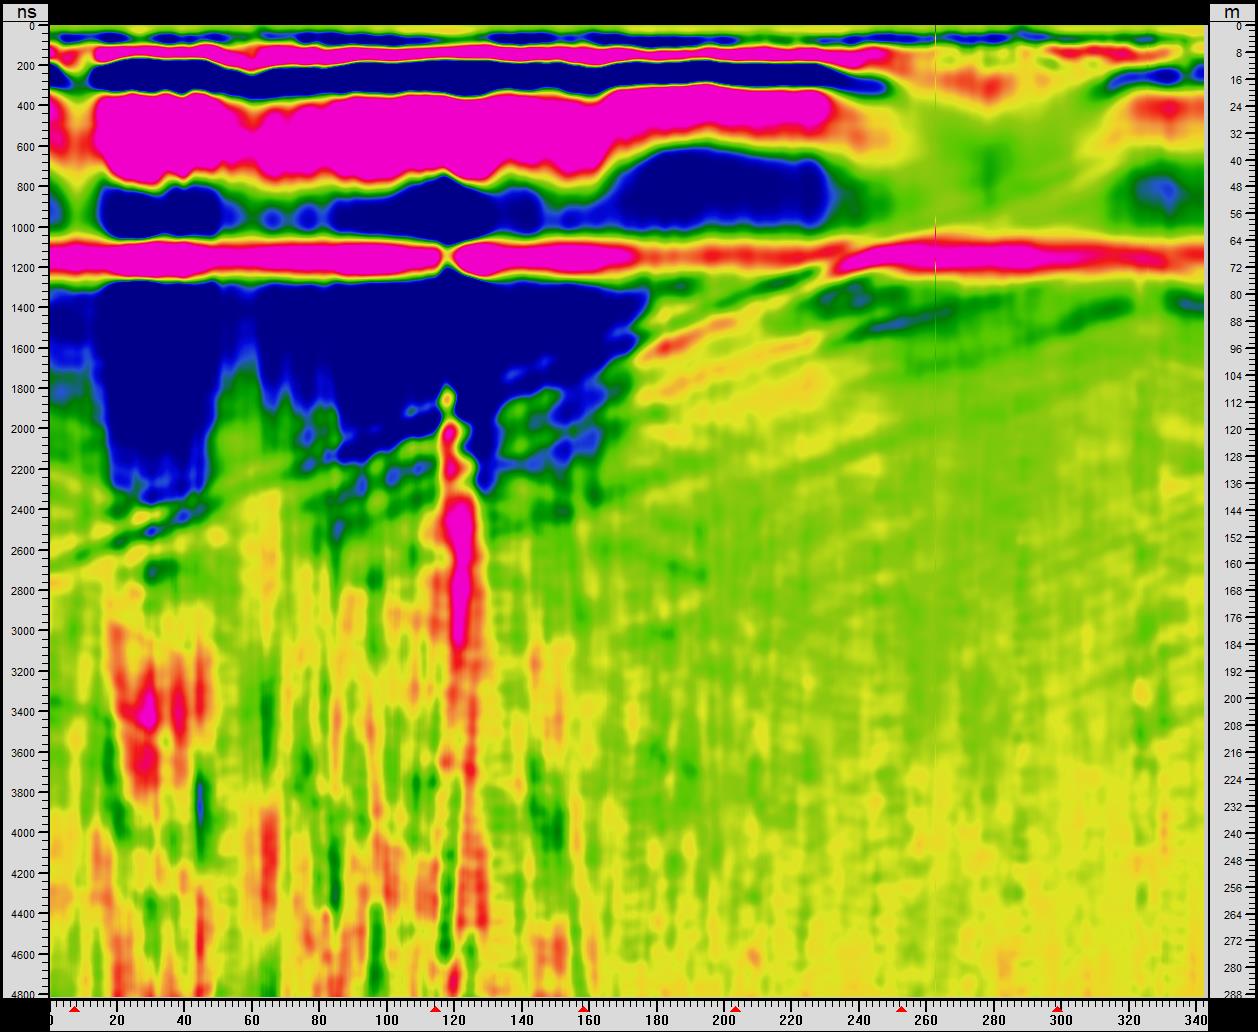
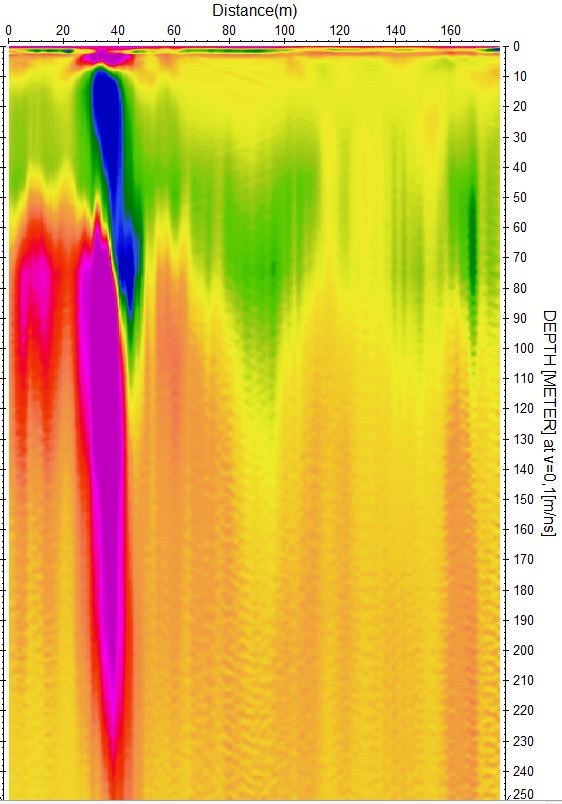
Radargram in a granite environment with a small layer of clay. The crack at a distance of 57 m from the upper layer at a depth of about 8 m “sucks” the water, it stays in it to a depth of about 40 m and then the water loses again. It is likely that the crack widens downwards and the water drains to great depths. The place for a water borehole will be more appropriate to choose in the middle part in purple colors. We can expect a water here from depths around 25 m. Despite the fact that there is an area in blue, according to the change in the phase of the wave, we can already see that the wave changes phase sharply, passes through zero (yellow) and turns to purple. Where the phase changes, so does the environment.

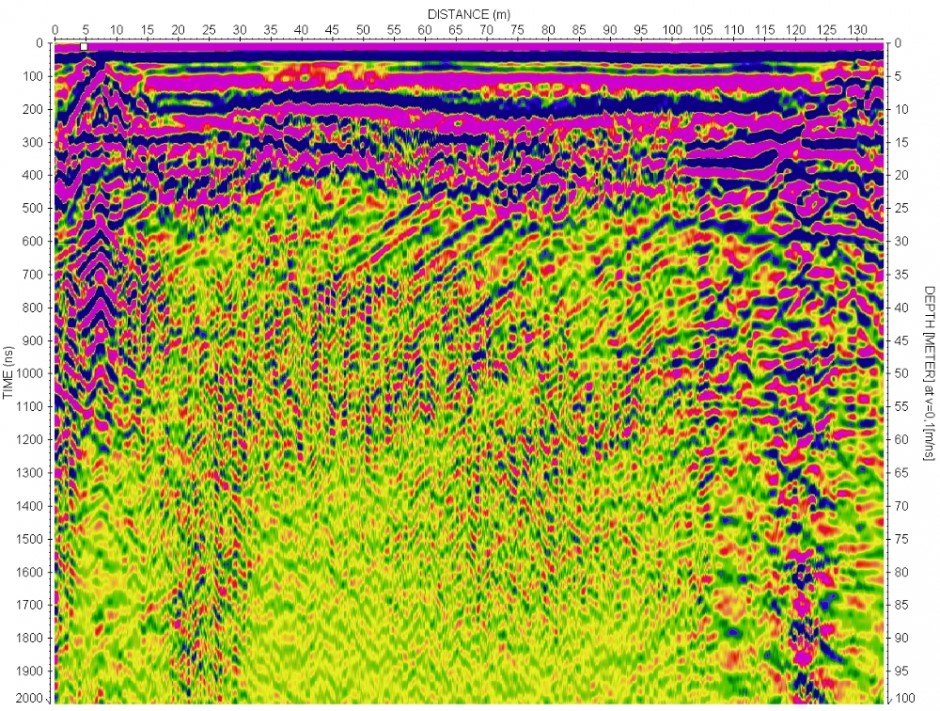
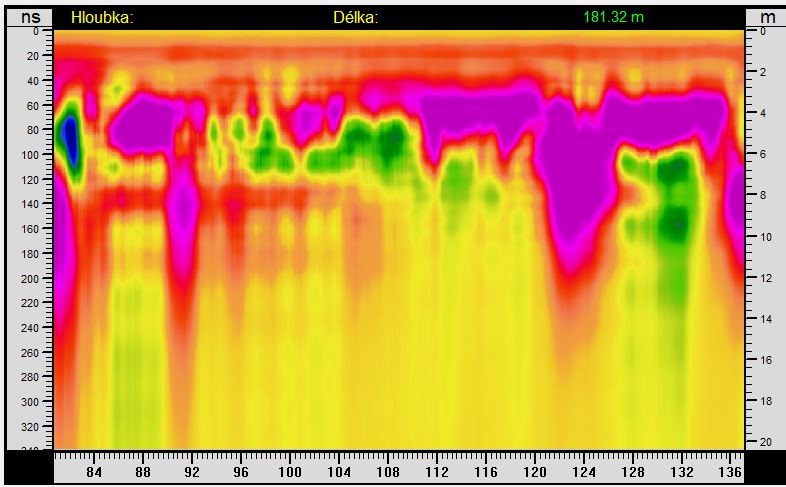
If we encounter a crack during the measurement, we can most likely determine whether it is “dry” or whether water is retained in it. Here is an example from the village of Kbel in the Kolín region (CZ). There are two cracks. The first is without water at a distance of 8 m. The second is waterlogged and is at a distance of about 125 m. In the axis of this crack about 100 m to the south, a KB-1 borehole was previously drilled to a depth of 76 m, where a fracture aquifer was found. Yield 1 l / s.
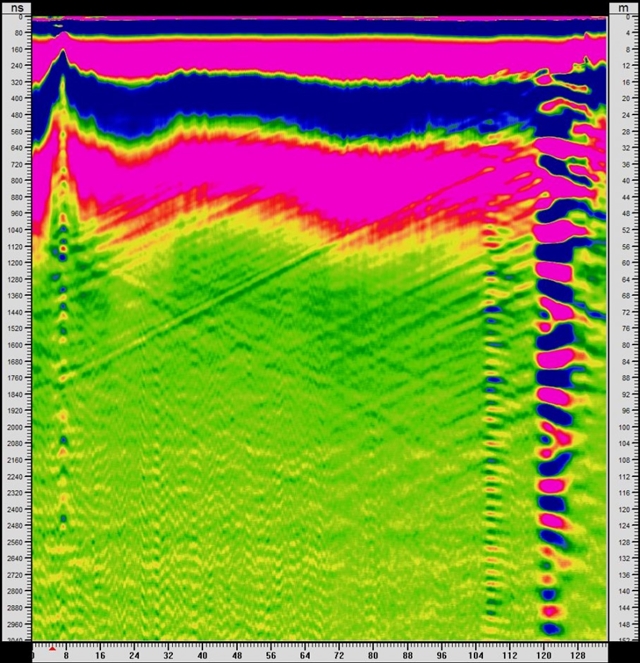
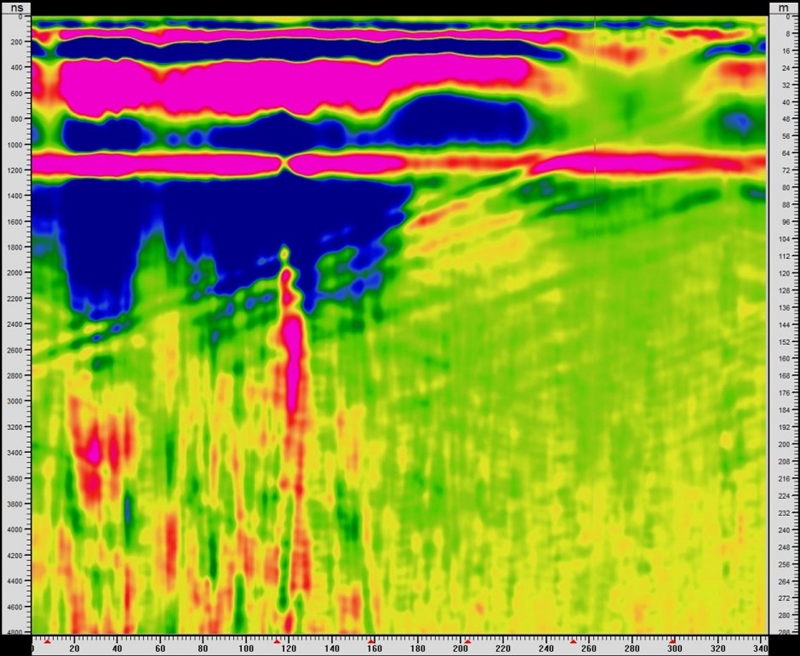
If we adjust the same radargram for higher frequencies, we can also look into the structure of the cracks. The one on the left will have smooth vertical walls in places, the right one will contain more crushed parts and it will be wider.

|