Tests. see deeper
|
List of accomplished tests: Antenna test (2020), The deepest reach (2017) |
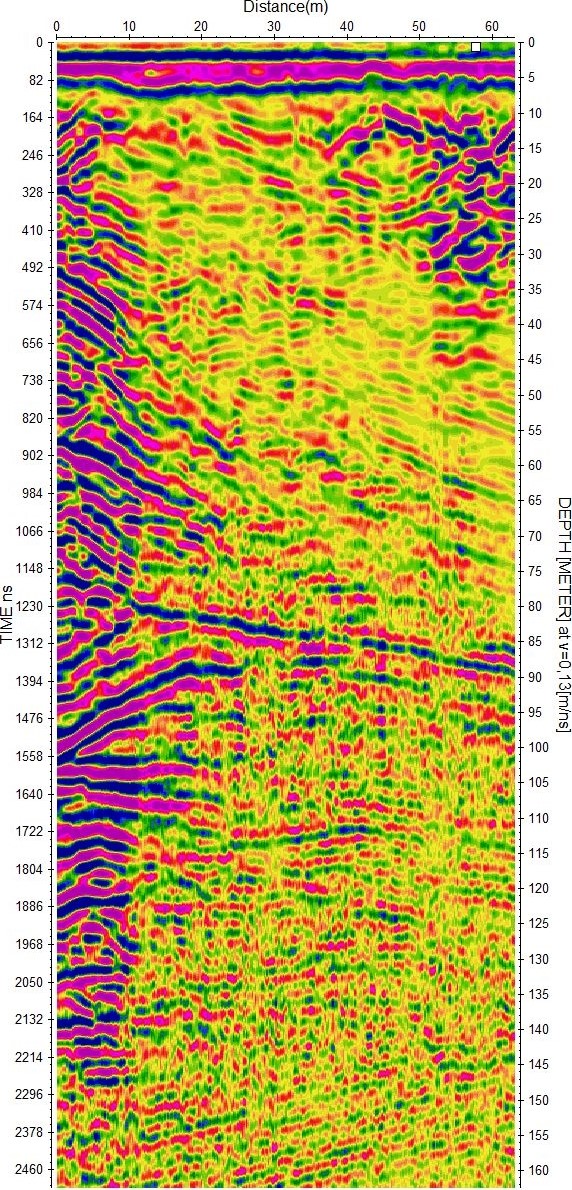
Antenna test (2020)We changed the arrangement of the antenna dipoles on the antenna with a center frequency of 50 MHz. The active area for energy transfer to the ground was increased about 3 times. We also changed the course of the values in the resistor separators and the result is several times greater depth range without resonances in the first layers. This can be compared to 6 m long antennas with half frequency. But we have a better resolution for small objects and the antennas are much better handled when passing between trees. The measurements took place on limestones near the Macocha abyss. The first radargram in the left part captures a number of reflections probably in a rock crack, there will be a lot of cavities and an oblique reflection at a depth of 80-90 m is from the interface of two types of limestone. In the upper one you can see obliquely inclined layers, the lower one does not have them. Reflections from a depth of 150 m are incredibly deep for this type of antenna. The theoretically predicted table range is max. 60 m. And here is probably the mistake, we are outside the table of ranges, so they probably do not want to publish articles in our professional journals.
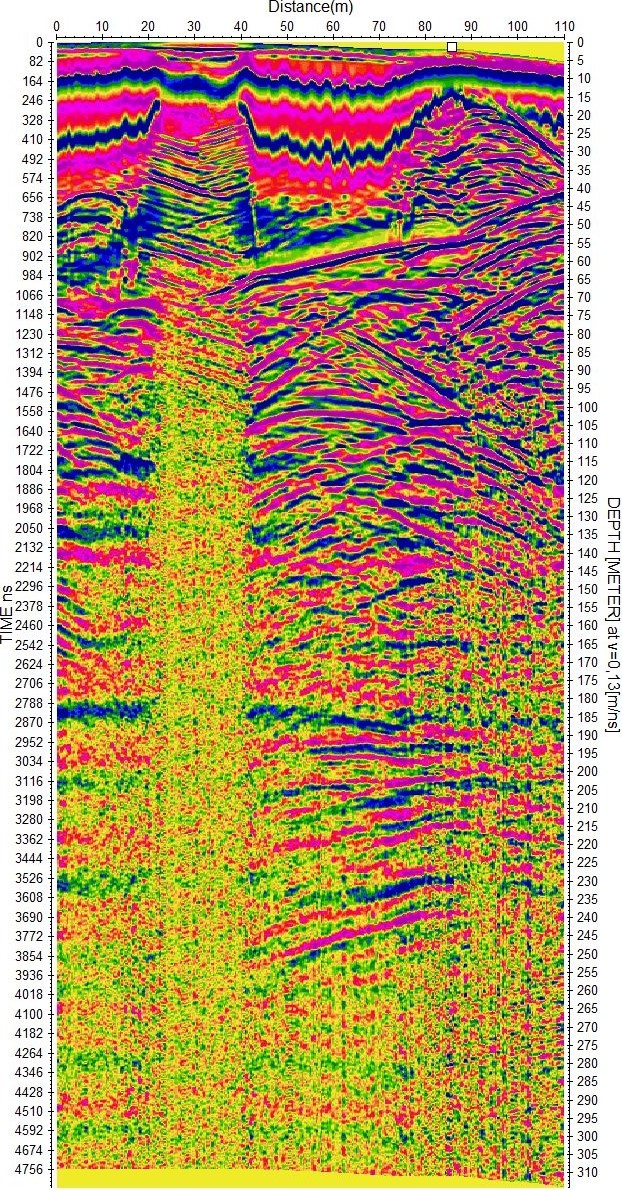
Another radargram is measured about 100 m further and 40 m higher in the meadow. At a distance of 20-40 m there is a large crack or rather a dirt-filled depression. It will end at a depth of about 60 m. Despite the filling, we do not see much depth, there is a great attenuation. The oblique long reflection at a depth of 60-70 m again separates the two types of limestone. The lower one is rich in a lot of cavities. The boundary between the limestones forms a sliding layer, it was possible to find an outcrop on the hillside, the lower surface is polished like a piece of marble. The vertical break can be at a distance of 85 m. Legible reflections at a depth of 240 m? Yes.
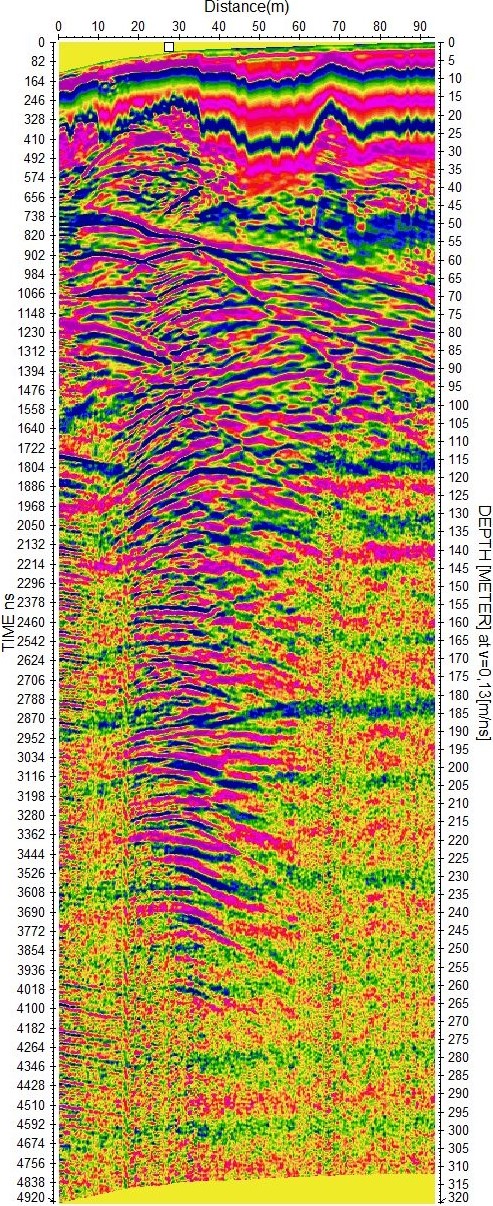
This profile is led in the opposite direction about 40 m next to it. It is better to see the perpendicular boundary at a distance of about 30 m, it continues to a depth of 260 m, there are still reflections from cracks.
At the bottom of the radargrams, some streaks seemed to shine through. We have a lot of broadband antennas, so let’s leave even the low frequencies there. And down here, the stripes were nicely highlighted. The reflections from the cavities end somewhere at a depth of 190 m and then only changes in the limestone layers are visible.
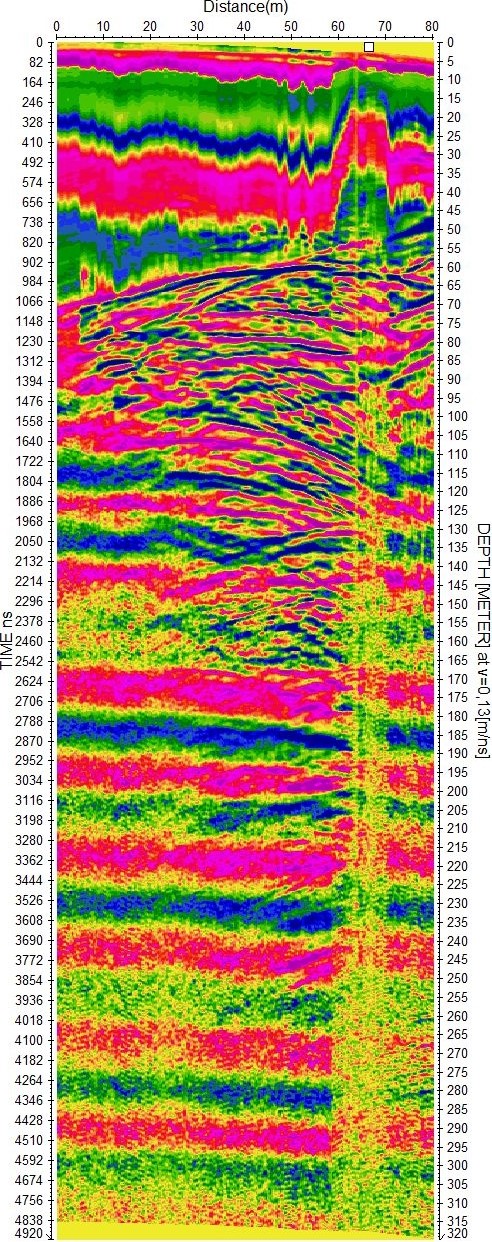
And here we passed another slightly longer profile with twice as long untreated antennas with a length of 6 m. The wavy long blue line at a depth of about 60-70 m is again the boundary of the limestones. On the right at a distance of 190-200 m – there is a huge cavity at a depth of 85 m, if there is air, its height will be 15-20 m. The other two huge cavities are at a depth of 250 m at a distance of 110 m and 190 m. But is it 100 m lower than the bottom of Macocha that there would be another cave system? |
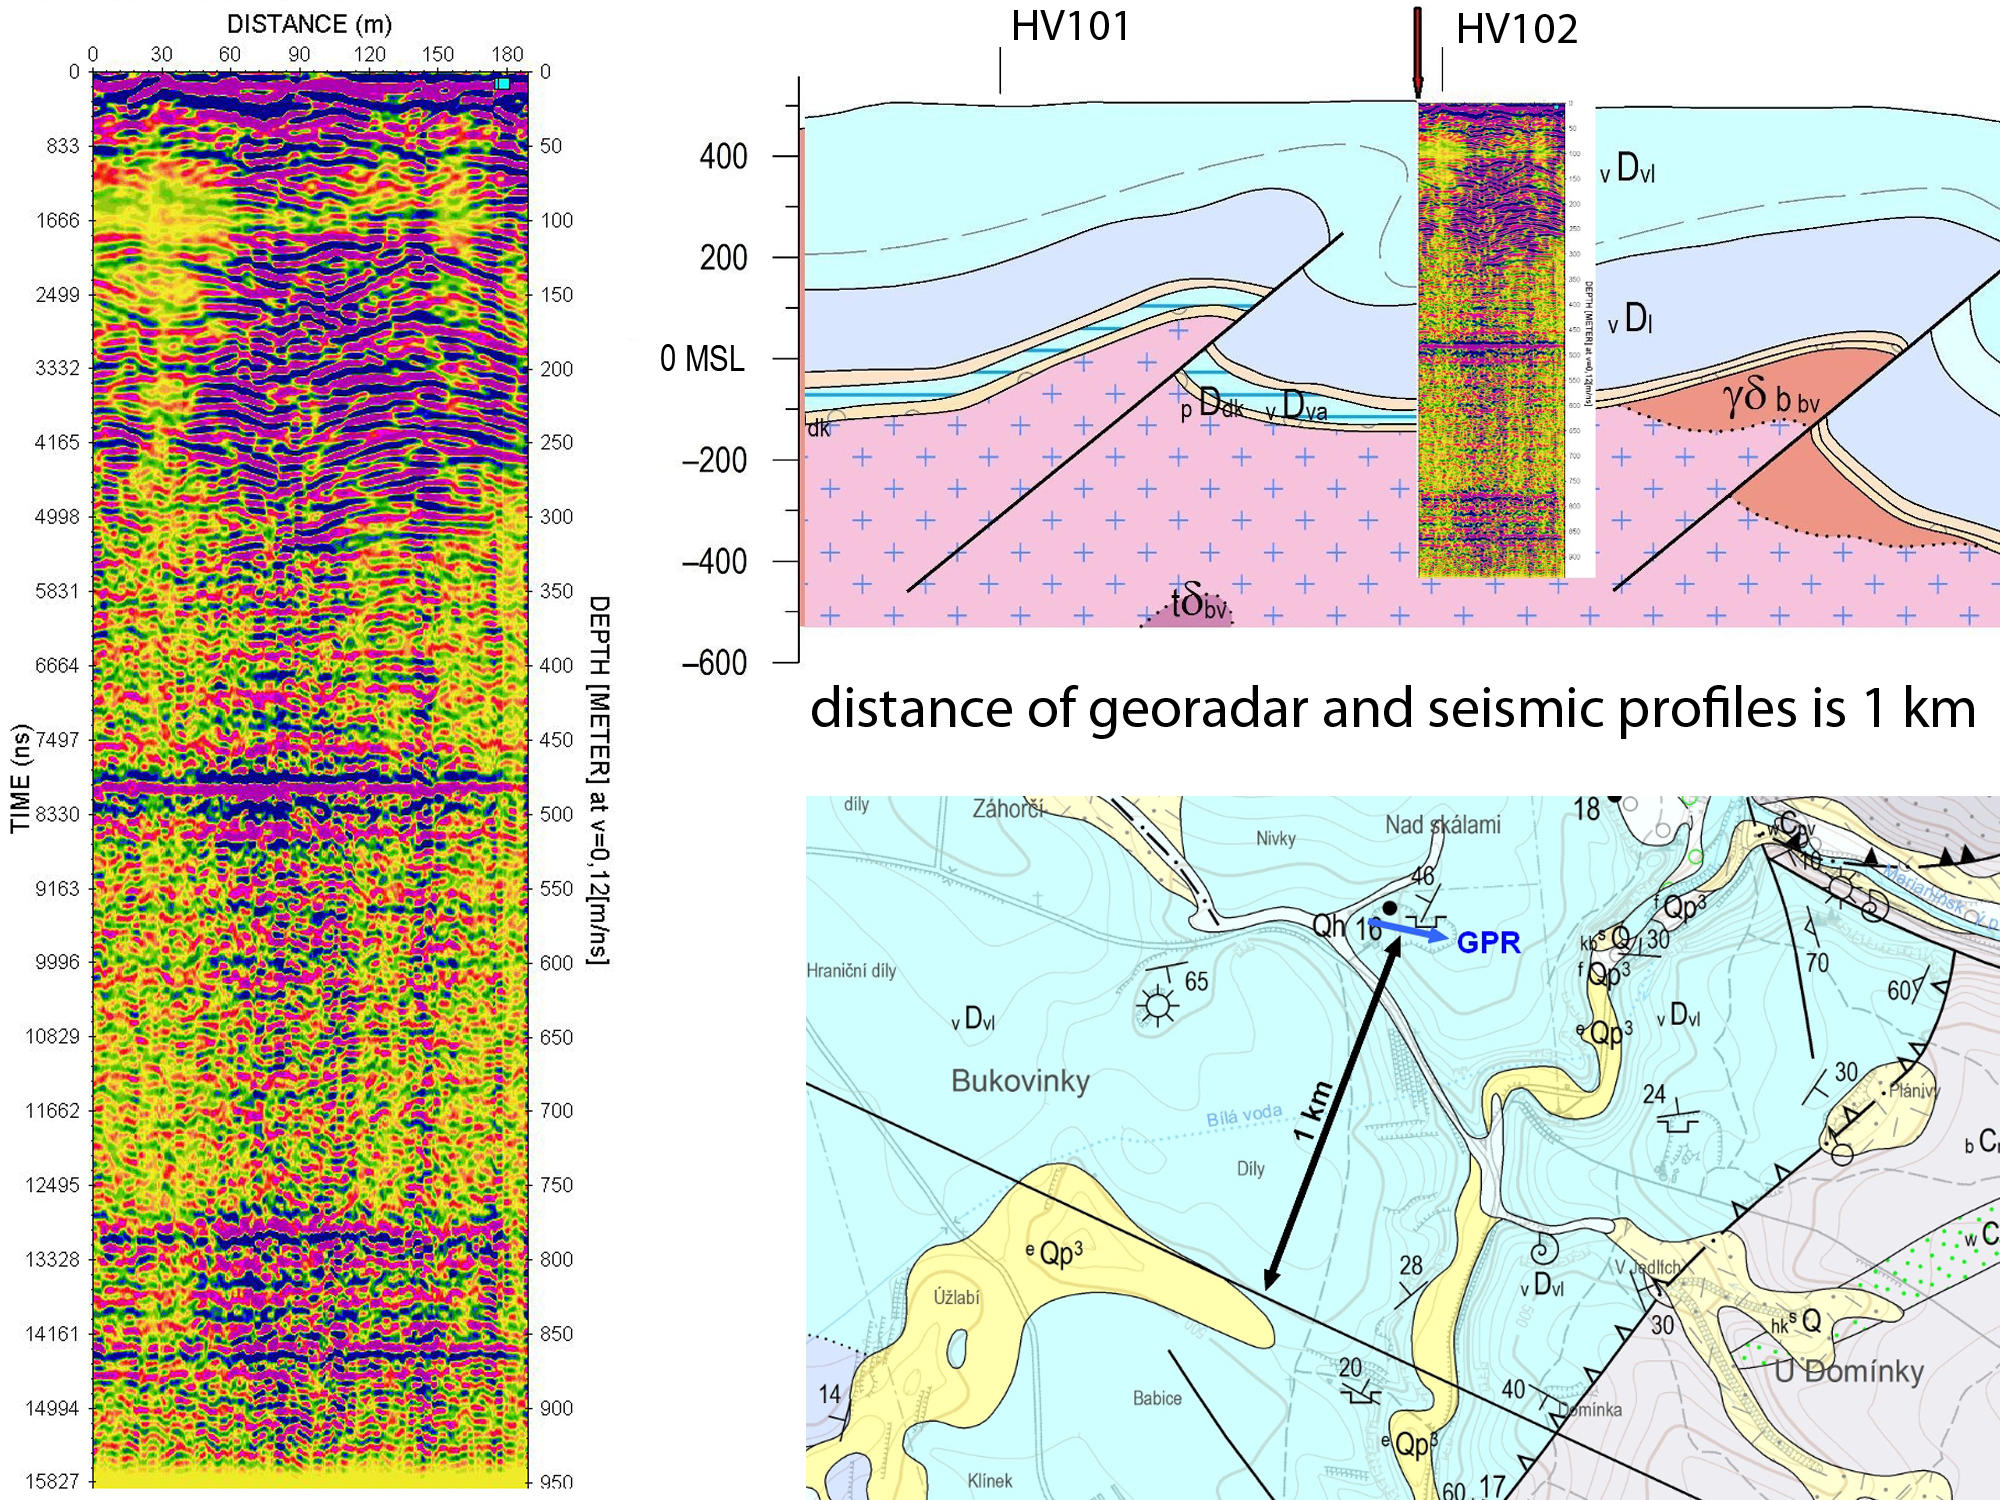
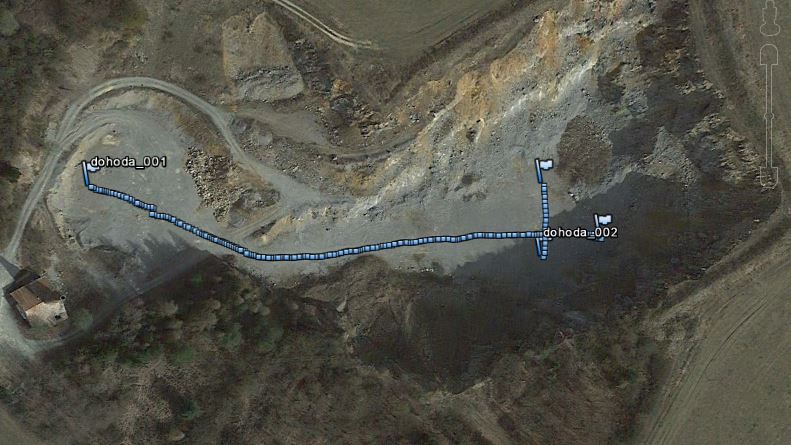
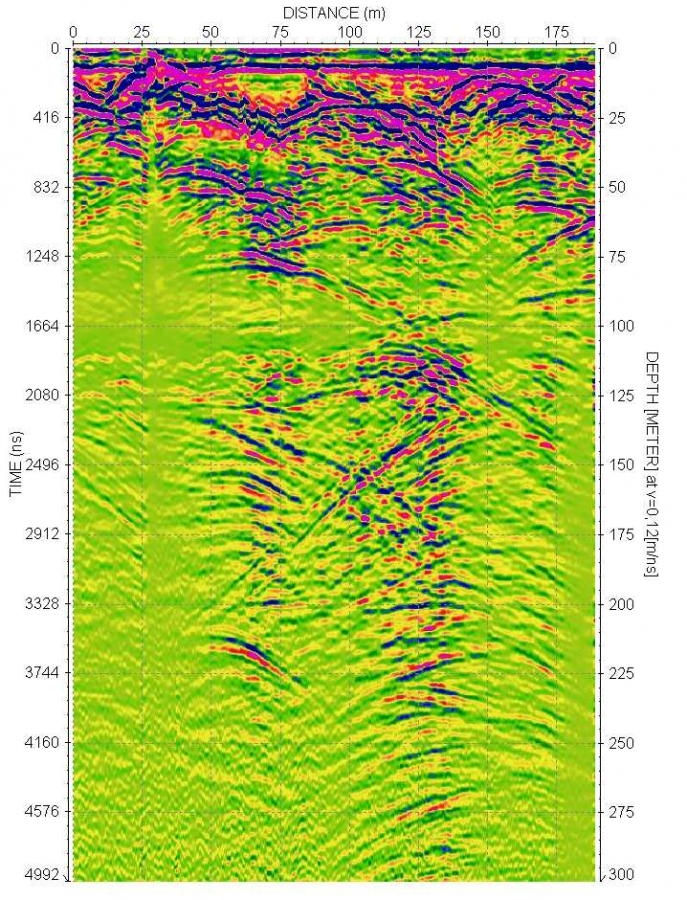
The deepest reach (2017)The new GPR Roteg is constantly being upgraded. Now we bring longer maximal time window. However it’s tricky to document the depth range. A well-documented site with voids in known depths have to be found and measurements on the surface must be feasible. In previous campaigns, reflections from a depth of 90 m (The Amateur Cave, Czechia), resp. 200 m (Postojna Caves in Slovenia) have been matched to documented caves and cracks. Particular reflections on images from Hranice karst site (Czechia) had also been linked to recently discovered caverns adjacent to Hranická Abyss. Several geophysicists question reflection from geological interfaces in depths around 500 m and claimed 25 MHz antenna system’s reach up to 40 m at maximum. Surface waves from far metallic objects or filtered-in artifacts were supposed to cause the deep reflection from scientists’ point of view. Nevertheless, such metallic object were not found in corresponding distances! The issue went so far that an article about deep measurements was not published. To defence our results, we designed a survey in old limestone quarry of Malá Dohoda close to Ostrov u Macochy, Moravian Karst region. Almost vertical walls lines the quarry floor, located 30 m below the surrounding terrain, eliminating surface reflections even on long distances. The wave propagates straight-forward and no reflections from far-located metallic conduits could be sensed. We set the time window up to 16 000 ns, which should cover up to 1 000 m in limestones. Towing the antenna on quarry surface provides optimal measuring conditions. A 190 m long profile spans whole quarry length, a 28 m long perpendicular profile covers the width. Measurement details were as follows: 25 MHz antenna, 20 kV pulse transmitter, 10 cm trigger interval, 57 260 samples, stacking up to 10 to suppress noise from 4.8 km far Kojál radio transmitter (emitting an overall wattage of 600 kW on frequency interval 87-778 MHz). One km distant geological section, constructed from deep-drilling cores HV101 and HV102 (on the right), provides comparison to measured data.
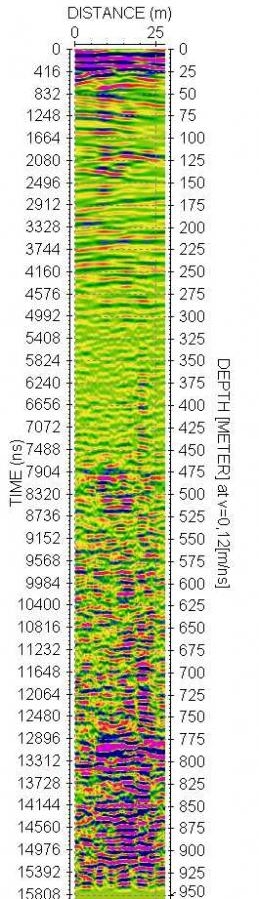
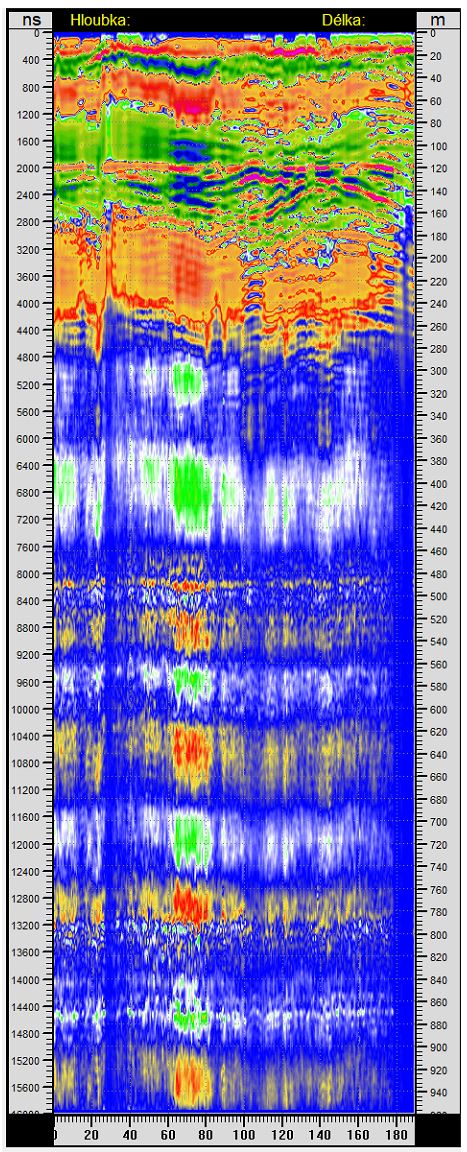
False, air waves from surface objects could theoretically arise at times around 200 ns, but not such a feature is seen there. If some were, nevertheless, reflected, they must have travelled into the area outside of the quarry and couldn’t reach back into the receiver antenna. A power line of high voltage, located 320 m aside from our profile, would create a continuous line reflection accross the whole radargram at times around 2 130 ns. Neither feature like that was recorded. The image is, then, not affected by the air waves from distant objects. So what is it, drawn in the radargrams? Strong reflections down to 300 m depth are predominantly generated on carst voids and cavities. Nearly horizontal interface in the depth of 475 m incides with limestone rock type alterations. The deeper strata is characterised by horizontal layering up to depths of 780 m, below where the combination of sandstone, conglomerate and graywacke should appear. Further down, a granite plume should be seated, possibly forming the interface at depths around 860 m. Detected interfaces on the radargram comply well with both the stratigraphy from the nearby geological section and the characteristic reflection shapes for the particular rock types and undulated interface below 750 m depth. For time-depth conversion a characteristic value of 0.12 m/ns was chosen as it was calibrated on several known undergroung caves nearby (Amateur and Holstein cave, e.g.). Then, the difference in depths given by radargram comparing to the geological section is about 20 % – in sense GPR brings deeper location of interfaces. The section, however, is located one km from the site and beside others, it was constructed from seismic measurements, which demand velocity estimations, too. A perpendicular profile is shown on the left and a detail of the voids up to 300 m depth from the previous radargram is on the right.
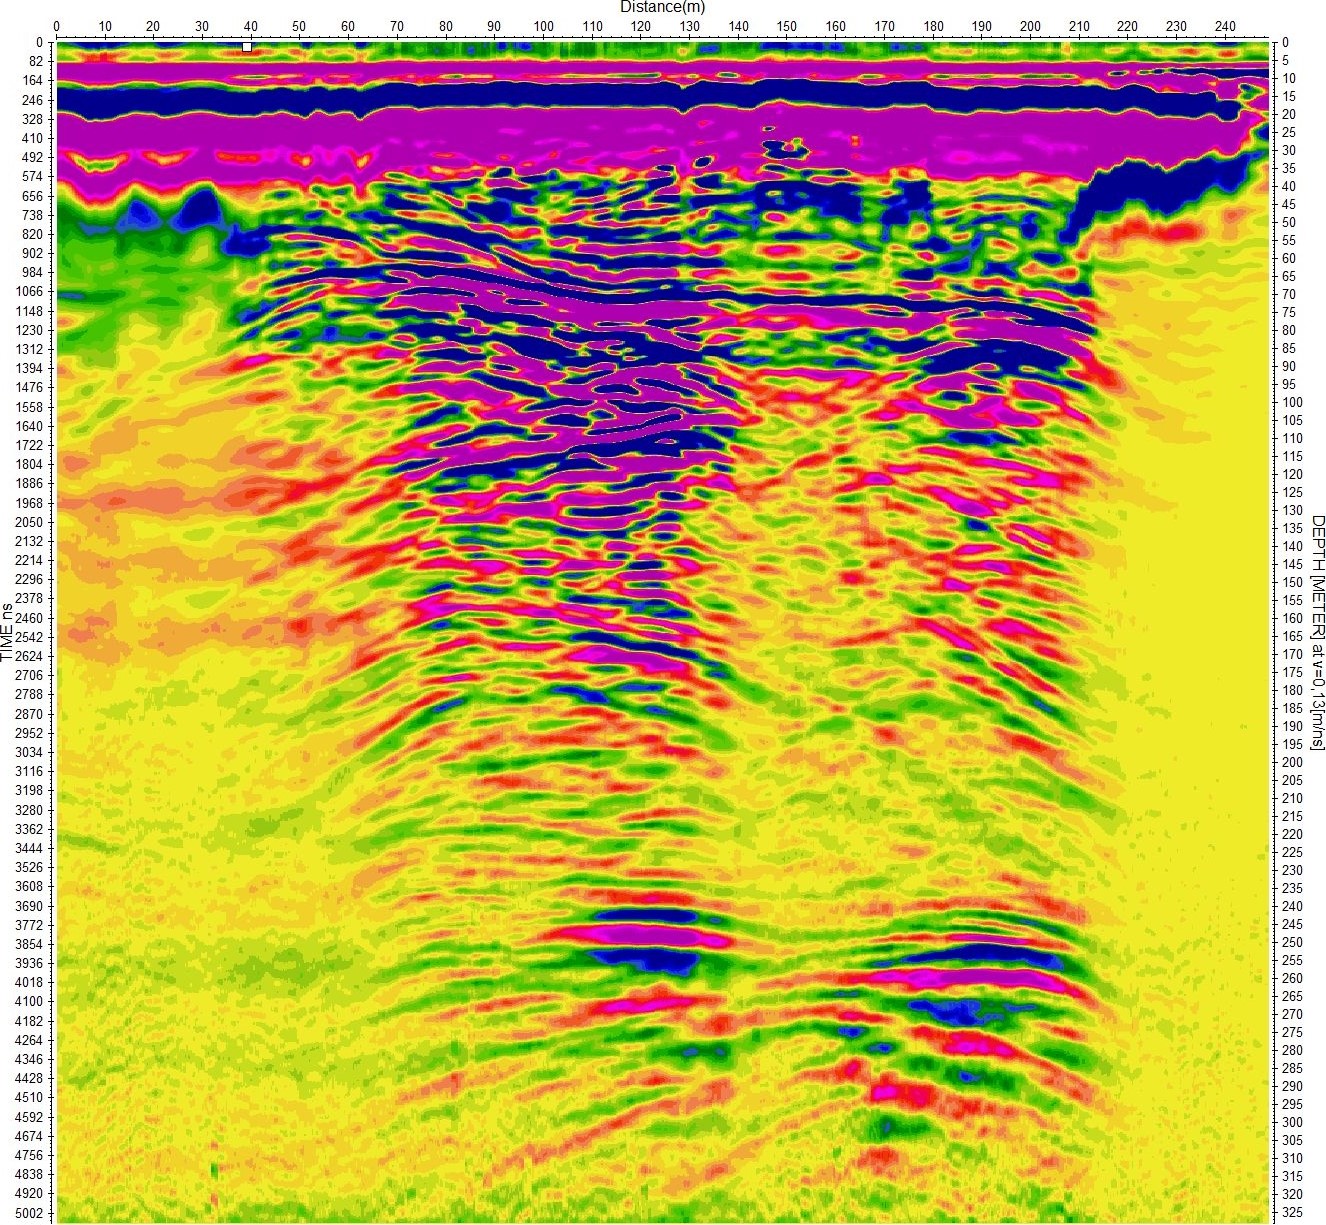
Beside measurements in ice, far different to the surveys in rocks, you probably won’t find any radargrams spanning down to a 200 m depth, either on the internet or elsewhere. We expect these survey results to be leading to antagonistic reactions. The raw data can be provided so we can assure anyone interested, that nothing was artificially added to the data. Only gain, trace averaging and frequency filtering (to eliminate the signal from Kojál radio station) were applied. We don’t mind measuring this or any other, geologically documented profile again to show the GPR Roteg capabilities (any questions, ideas or contact welcome). Appendix 12/2020 We also processed the measured data in our Spirio program. The color scales are adjusted and for the first image the frequencies are limited to 6 MHz.
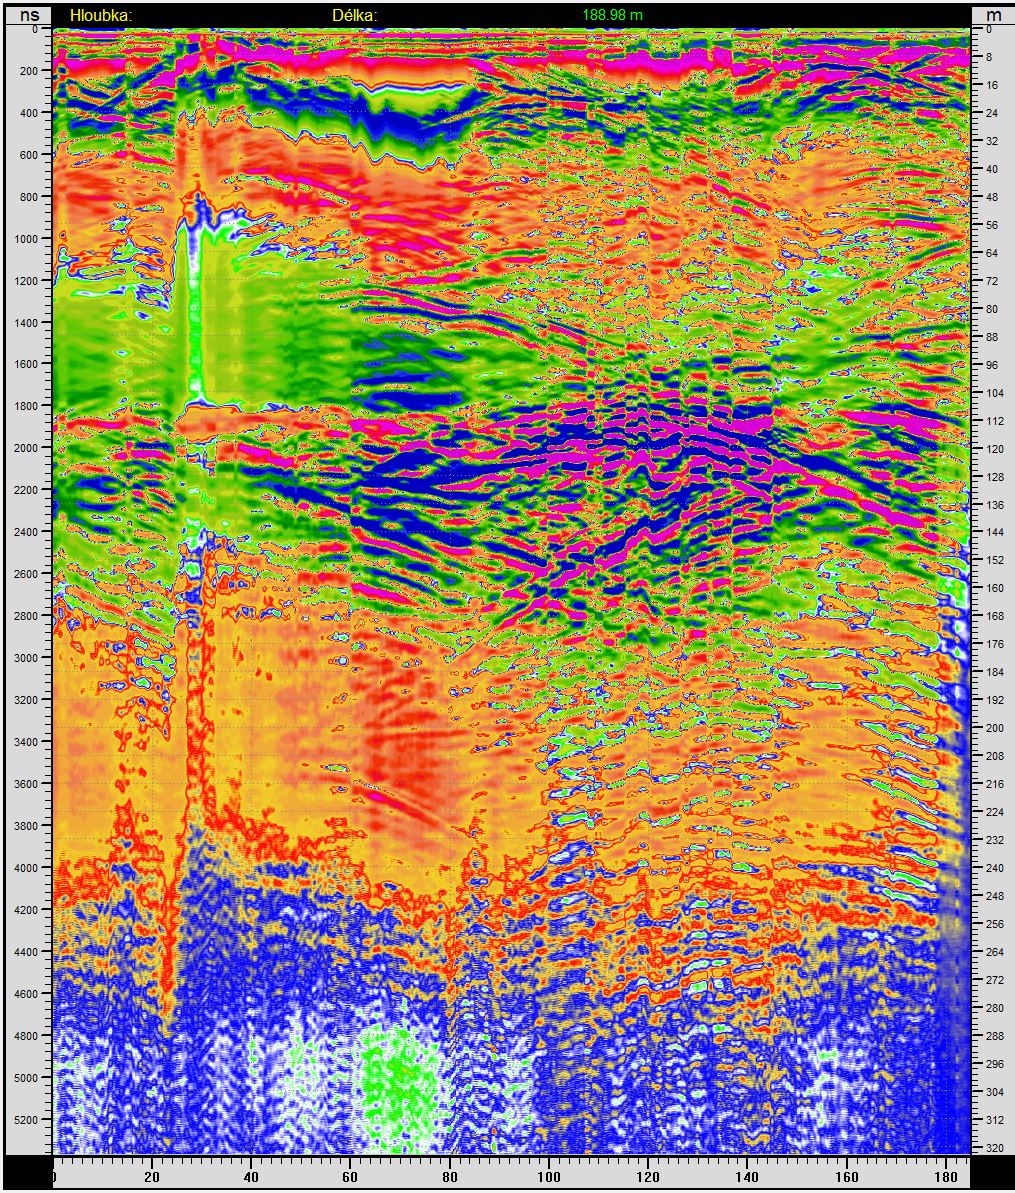
Detail to a depth of 320 m with frequencies up to 80 MHz. Vertical crack at a distance of 30 m, long cavity at a depth of 80 m, at a depth of 105 m probably the interface of two types of limestone, the one below will be more water soluble, there are many cavities – these are the very contrasting red-blue reflections.
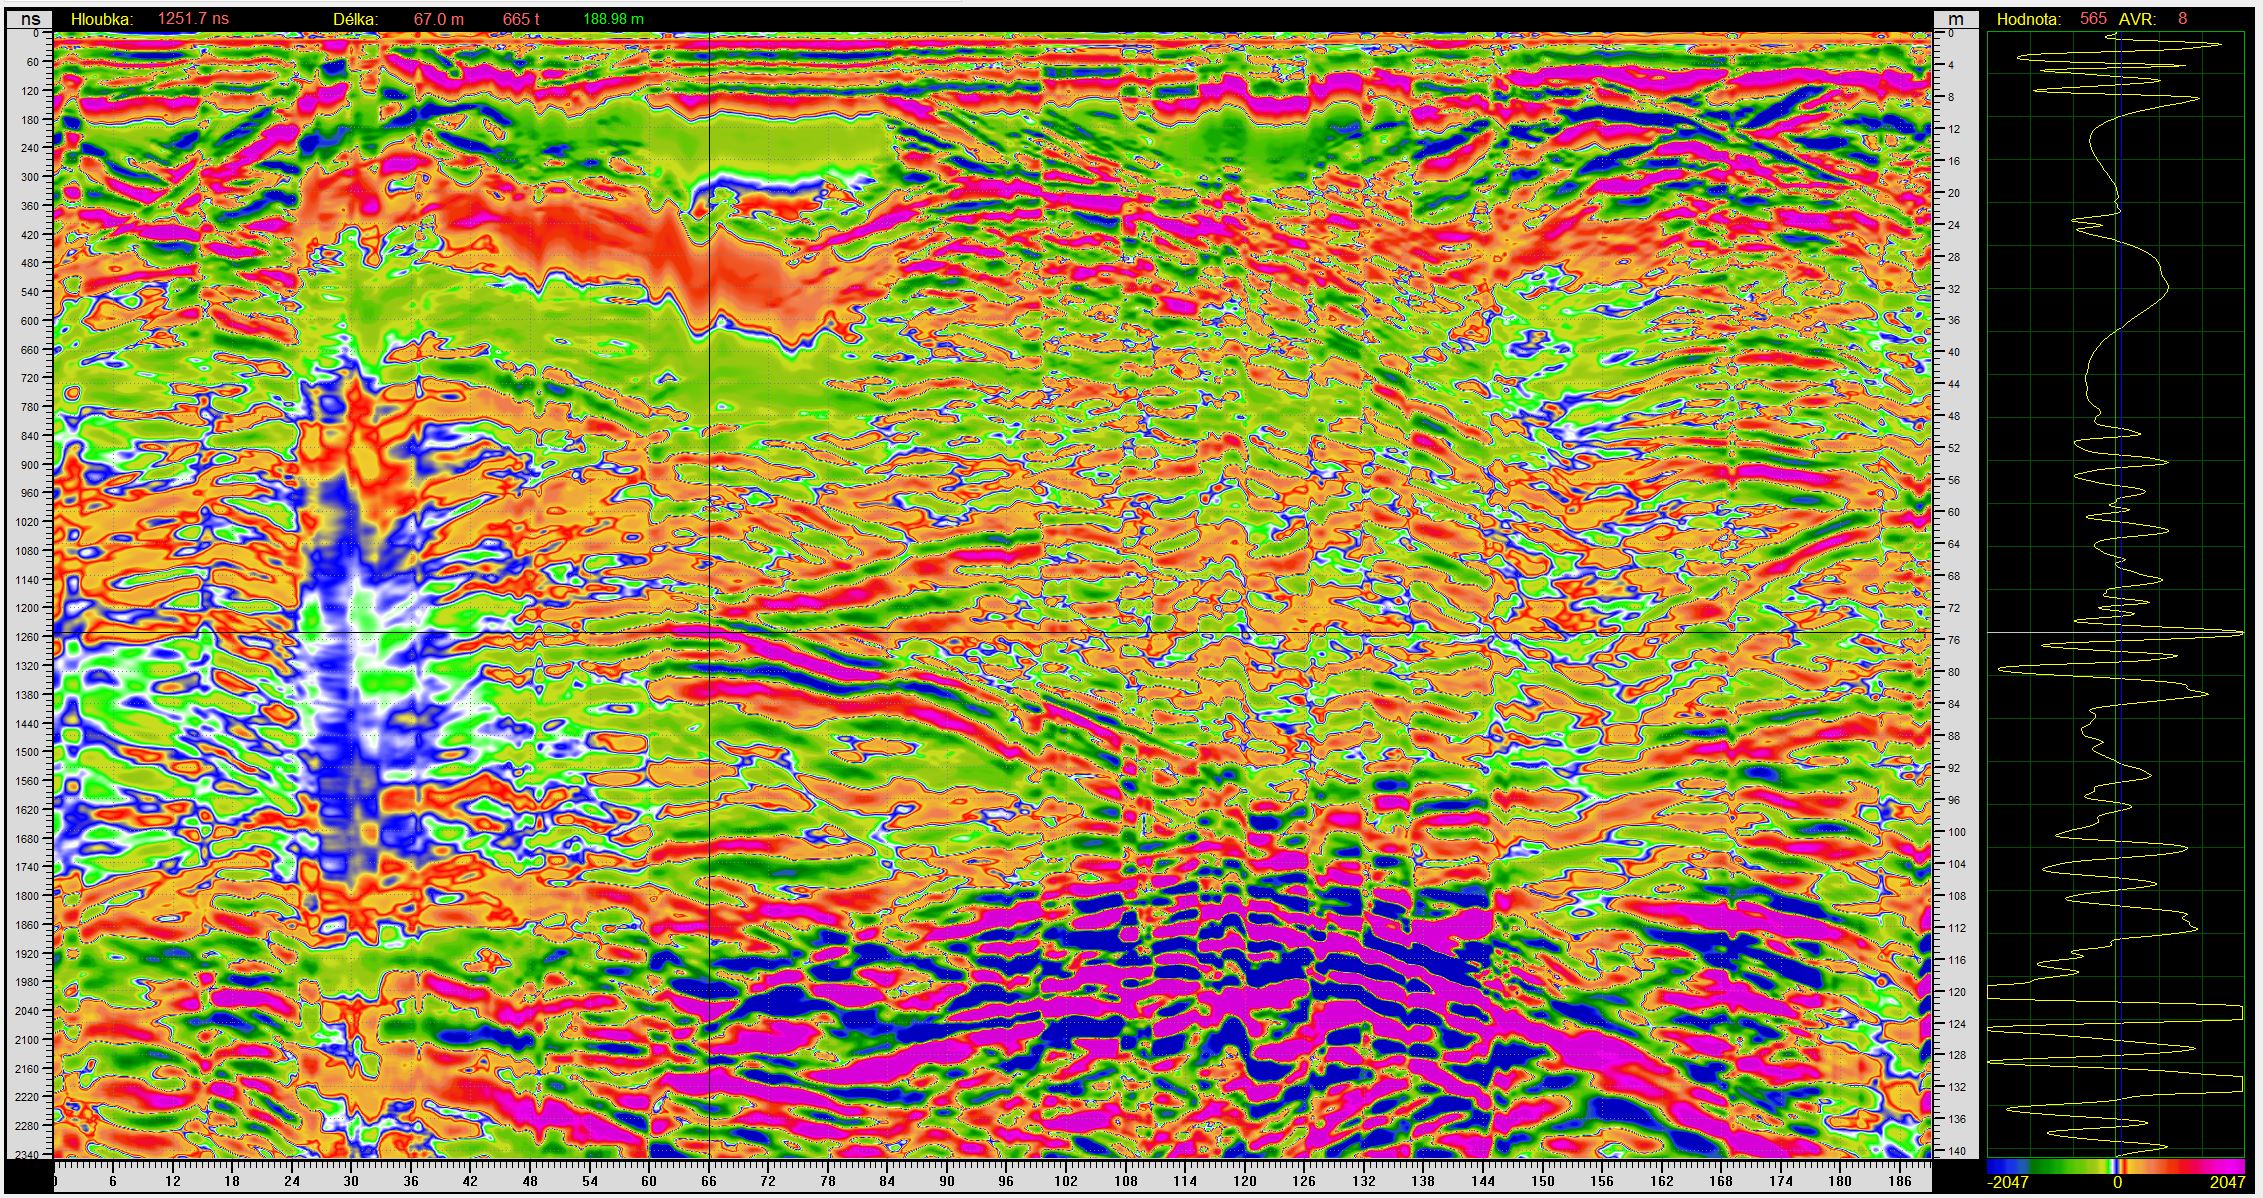
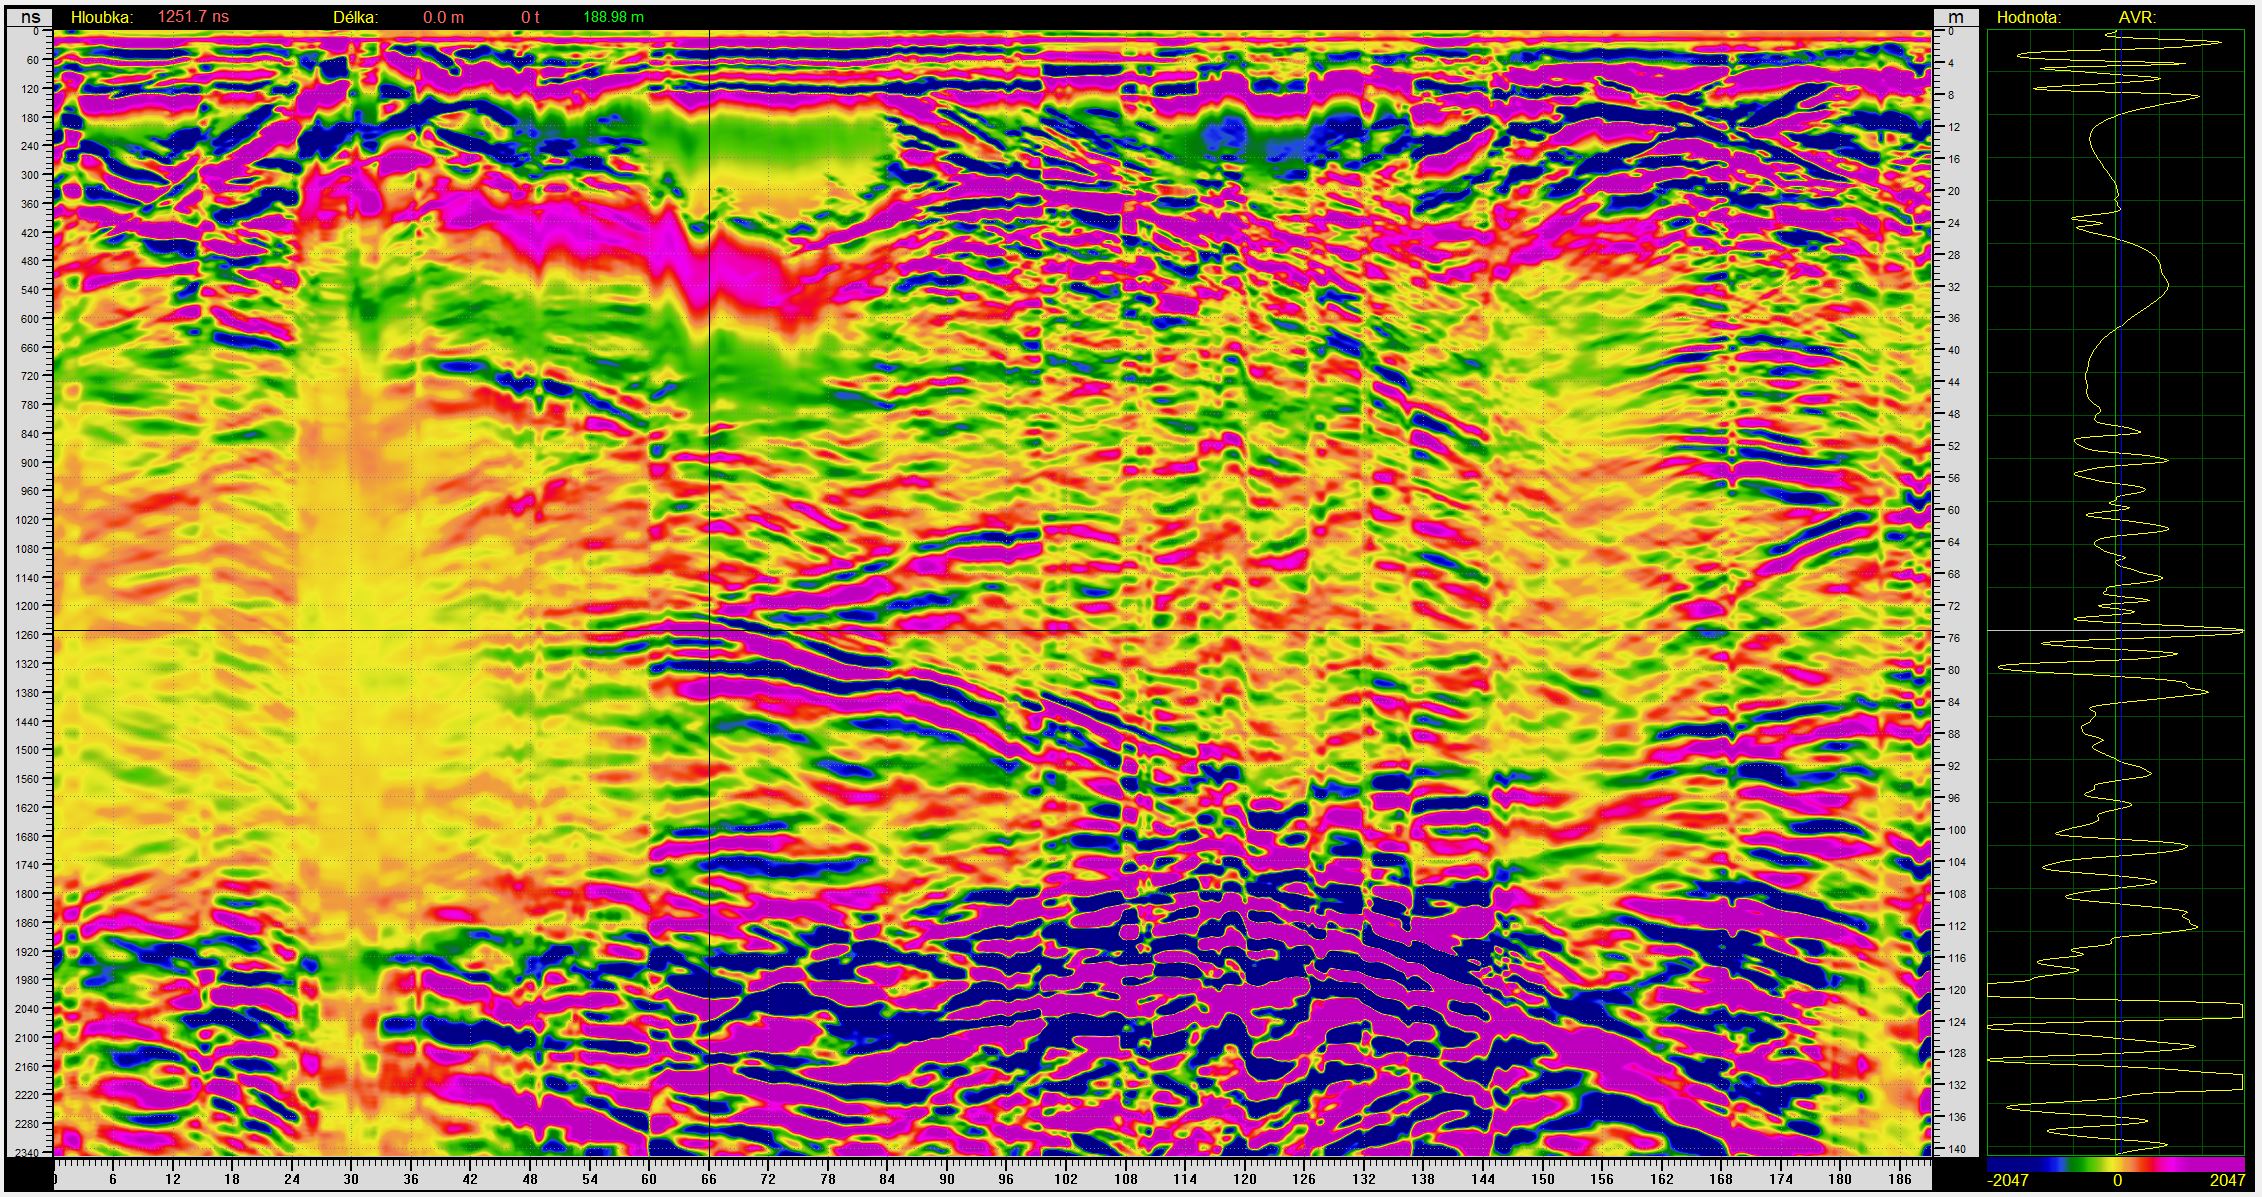
View to a depth of 140 m with frequencies of 5-80 MHz. On the right, record the wave at the cross position and below the wave, use the color scale for the wave values. By cutting off the low frequencies, more details appeared and, for example, it is better to see the crack structure on the left at a distance of about 30 m. The elongated reflection approximately in the middle of the radargram will be a cavity 50-60 m long.
If we use a different color scale to display the reflected wave, we can highlight reflections from most cavities.
|