| With Polish geophysicists, we measured a fracture in limestone near Krakow. They did not reach the required depth with their georadars and invited Pavel Morozov from Moscow with Loza georadar, and he again called me that it would be good if I came with Roteg. Comparing two different georadars on the same profile is always very instructive, so I didn’t hesitate and on October 2, 2017 we met at the place of measurement. A total of four profiles were measured, always back and forth. Mr. Morozov’s report describes the processing of data from Loza and Roteg using the Krot program. It processes the data more like an image using sine and cosine filters, derivatives, etc. I processed the data using the Reflex program, especially using frequency filtering. The resulting radargrams are a little different, each giving a little different information. But there are no differences in fundamental things. In Reflex, signals from greater depths were also amplified in the Roteg data. This is because the Roteg recording device has about 30 times higher resolution in measuring the amplitude of the wave and the sampling frequency of the wave 20 times higher. The Krot program cannot fully process this data, it is designed for the Loza georadar.
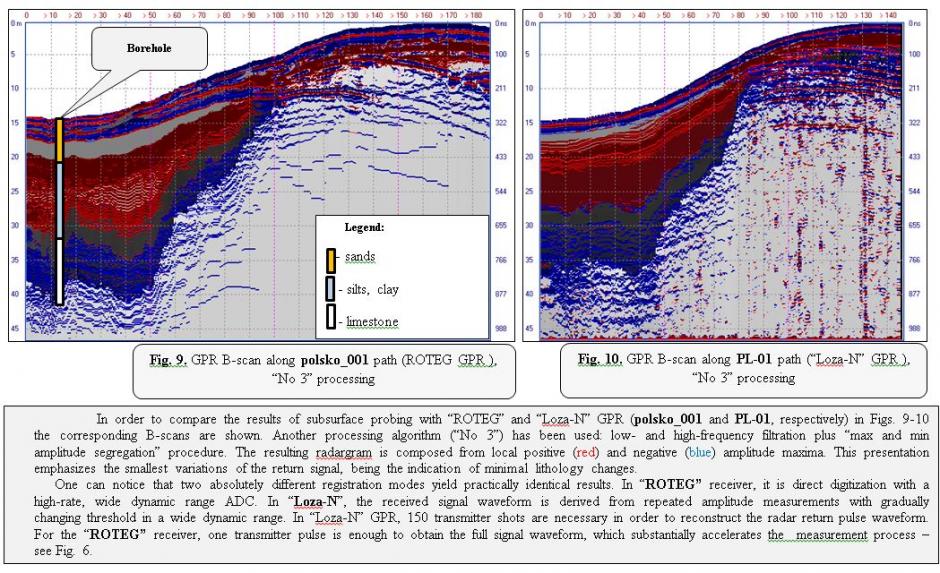
Here are two pictures processed by Mr. Morozov and the program Krot. Left data from Roteg right from Loza.
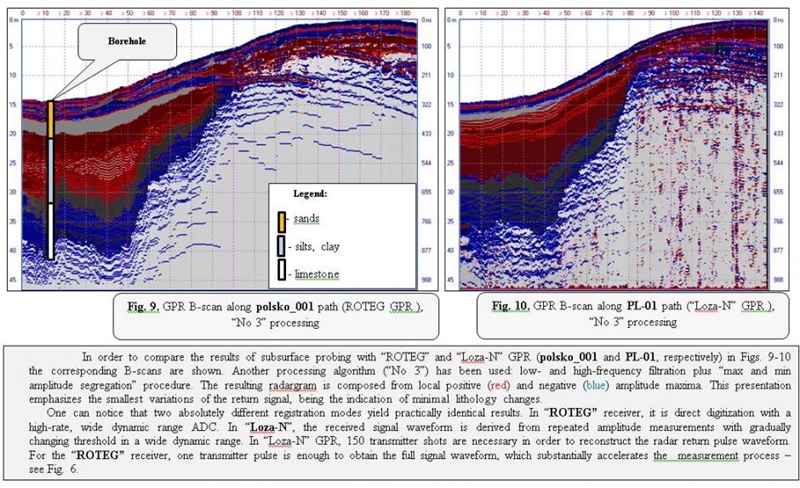
The thickness of the layers to a depth of 5-10 m is greater in Roteg. This is clearly visible in the upper left part of the radargram. This is due to the larger dynamic range of the Roteg input receiver, which has additional dynamics, unlike the Loza, which has a higher degree of compression without the possibility of adjusting the attenuation, and here probably has the first reflections in the limitation. By comparing the lower left part of the radargram, you can see a better rendering of the layers in Roteg due to the higher resolution of the receiver. Below a depth of 45 m, there is no longer any information in Krot, so the image was cropped at this depth.
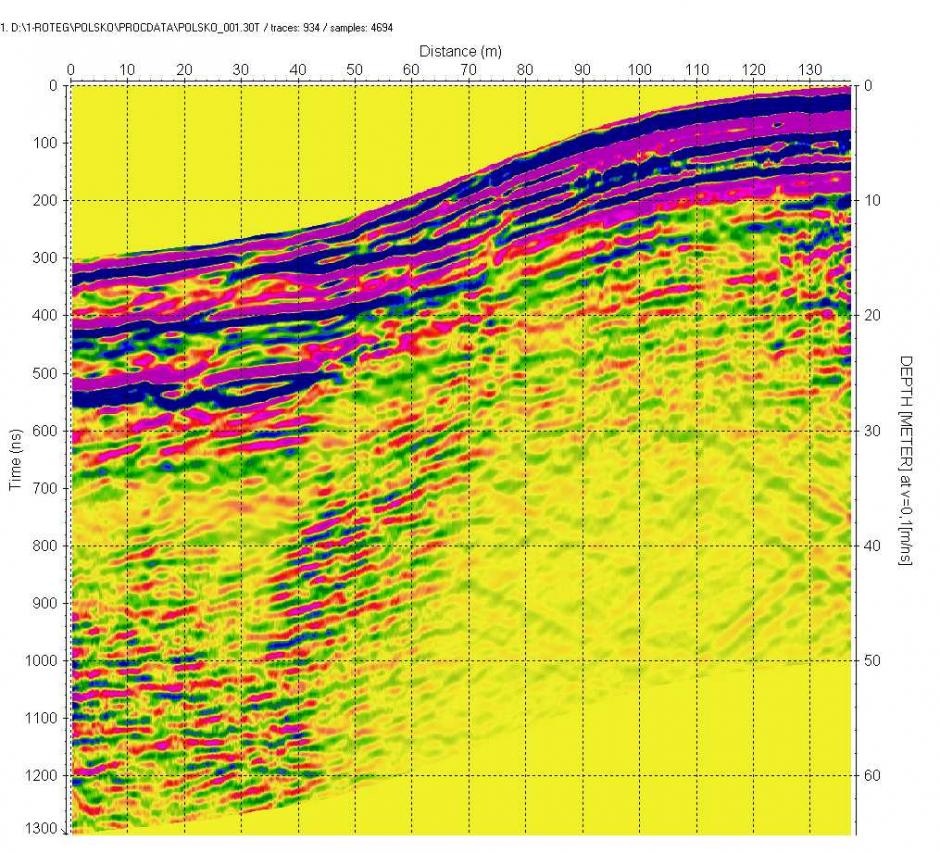
Roteg – radargram without modifications, only measured data.
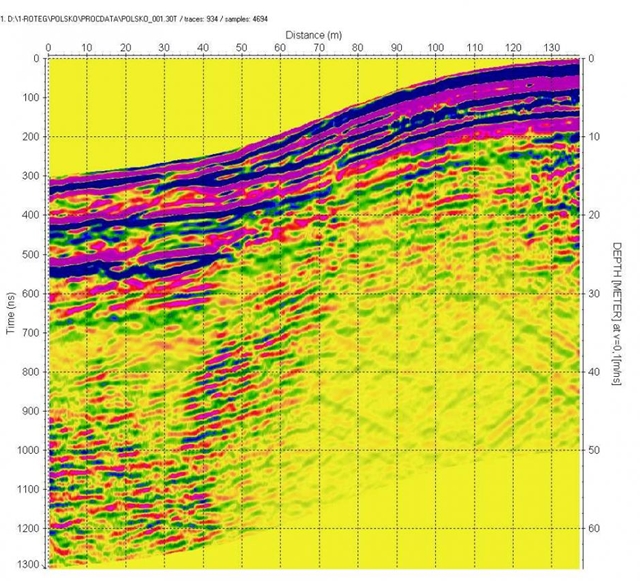
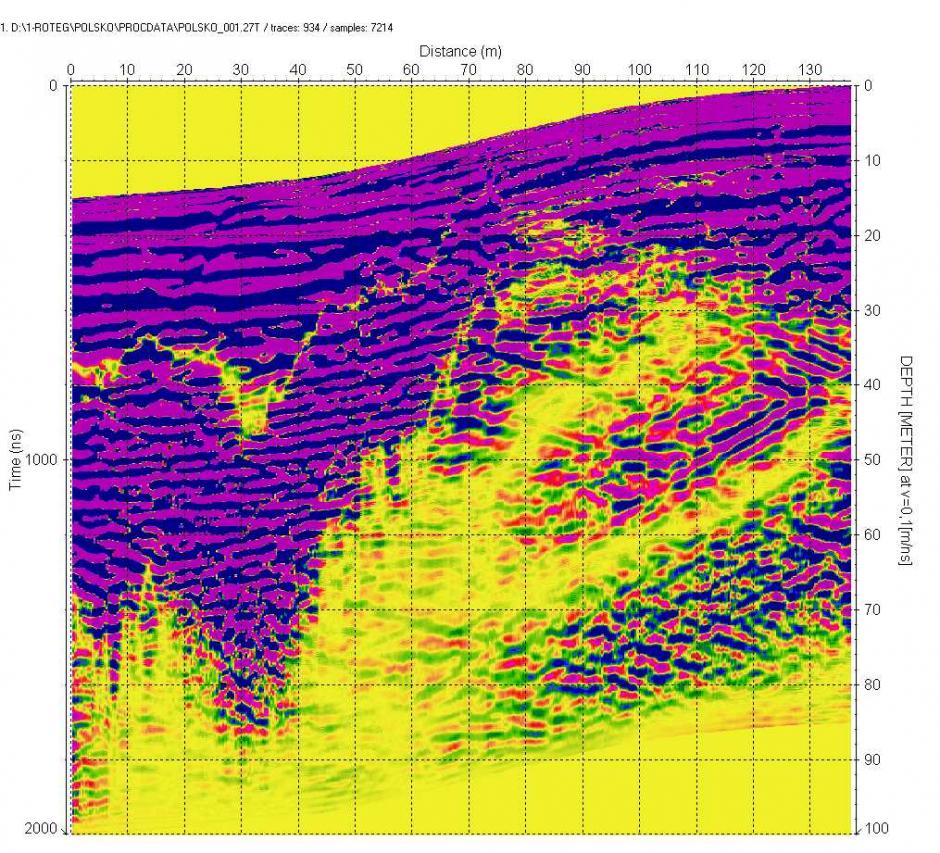
Radargram after spectral bleaching in Reflex. You can already notice that there are different types of reflections in the blocks separated by yellow. They may have a different material or rather the layers in the limestones may be at a different slope.

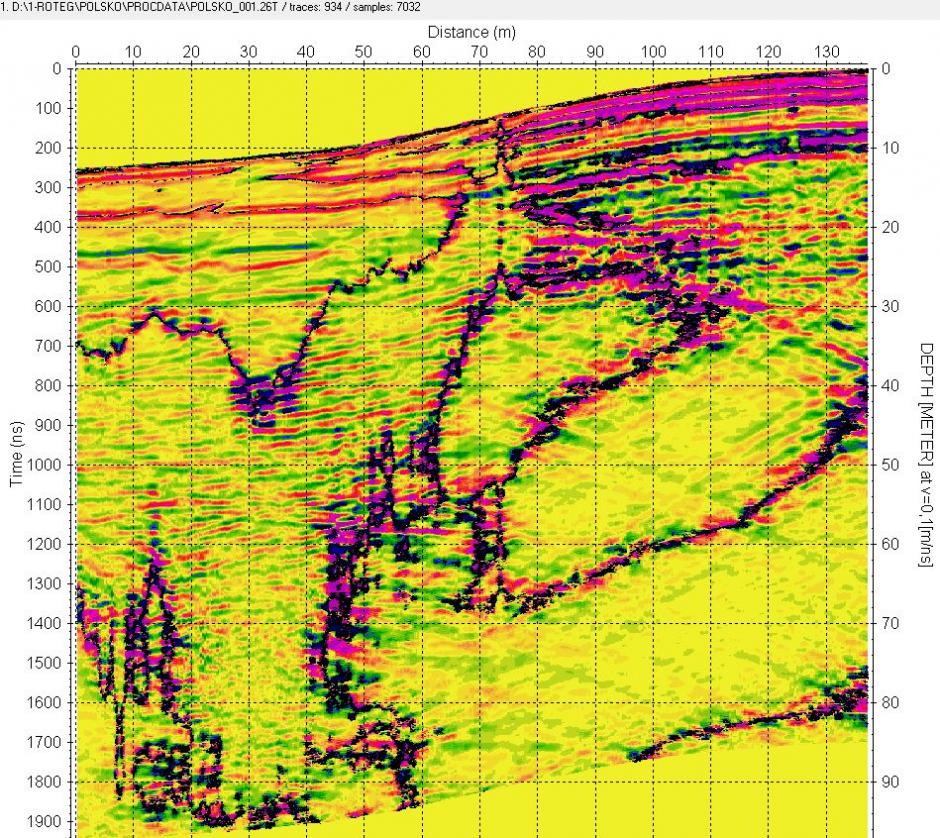
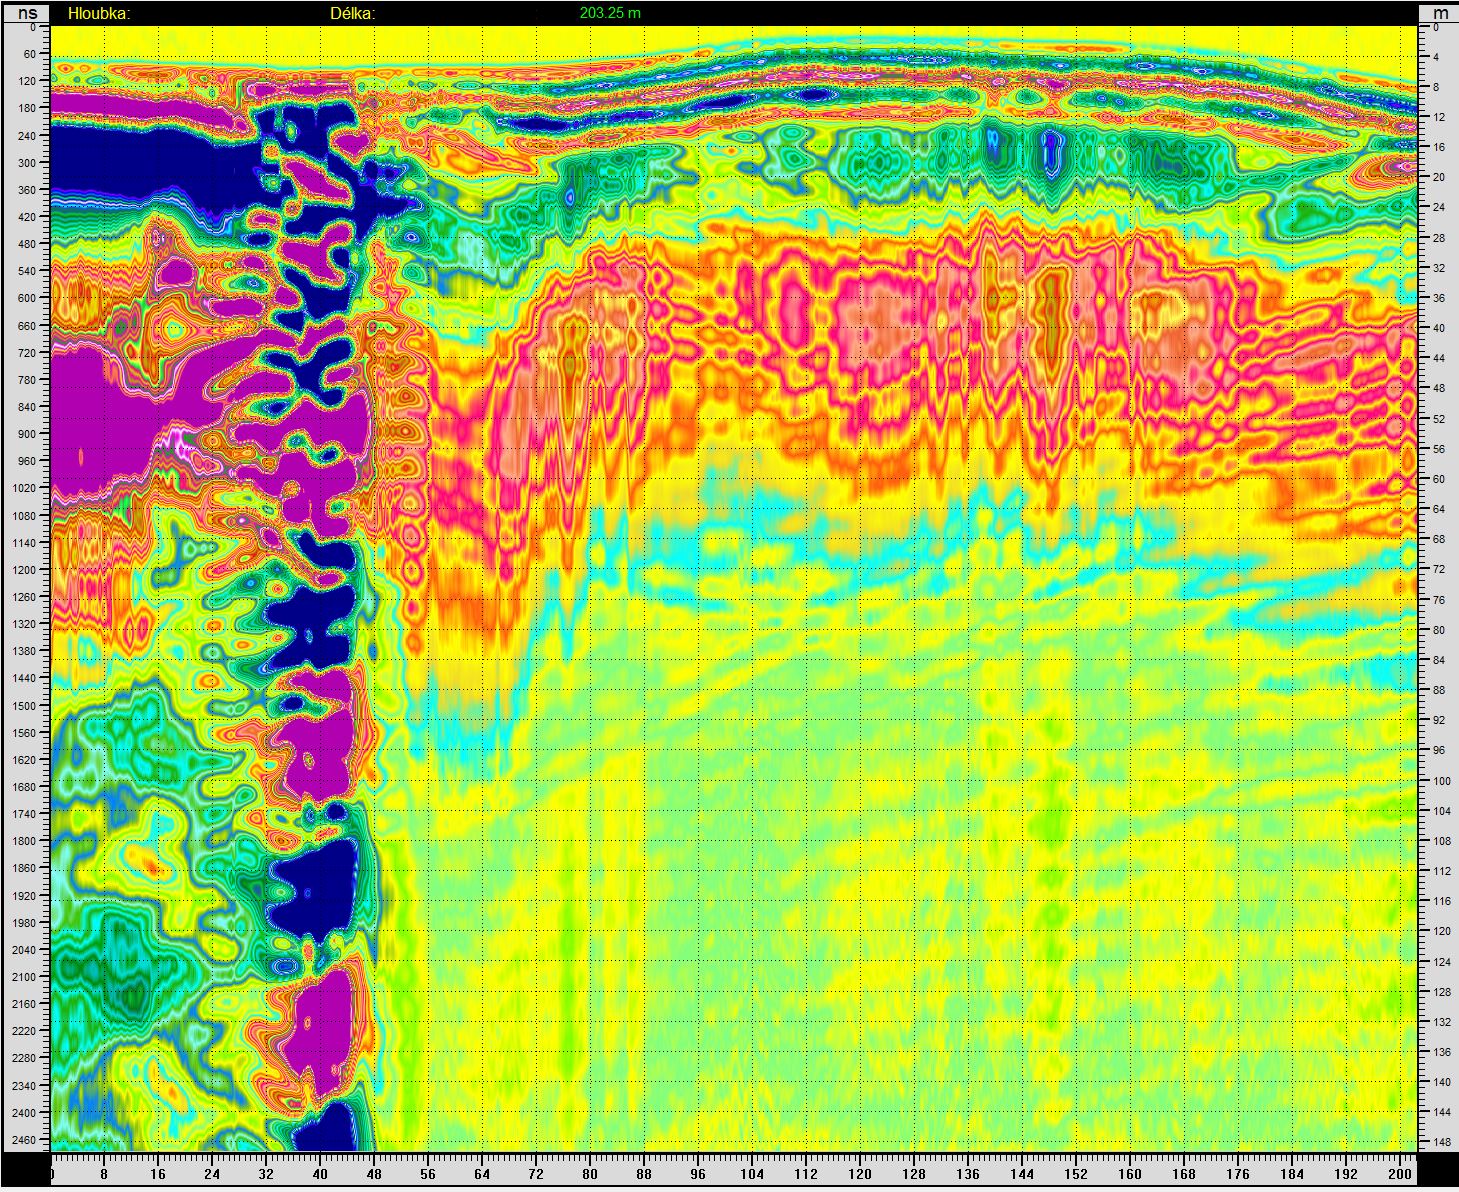
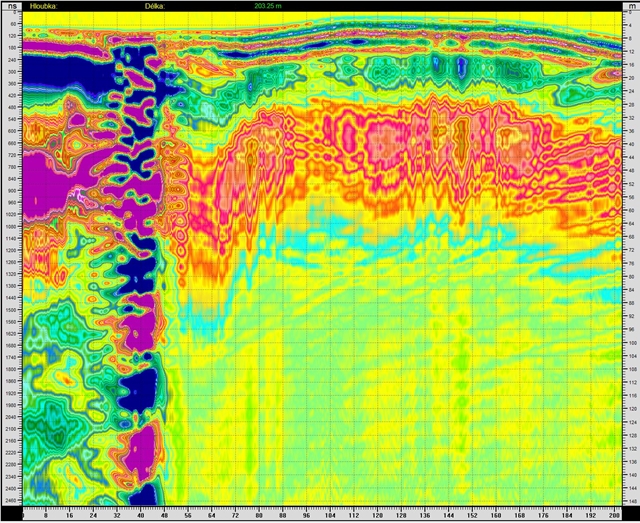
By using derivatives and isolines, the boundaries of these blocks can be better highlighted. Here up to a depth of 100 m.

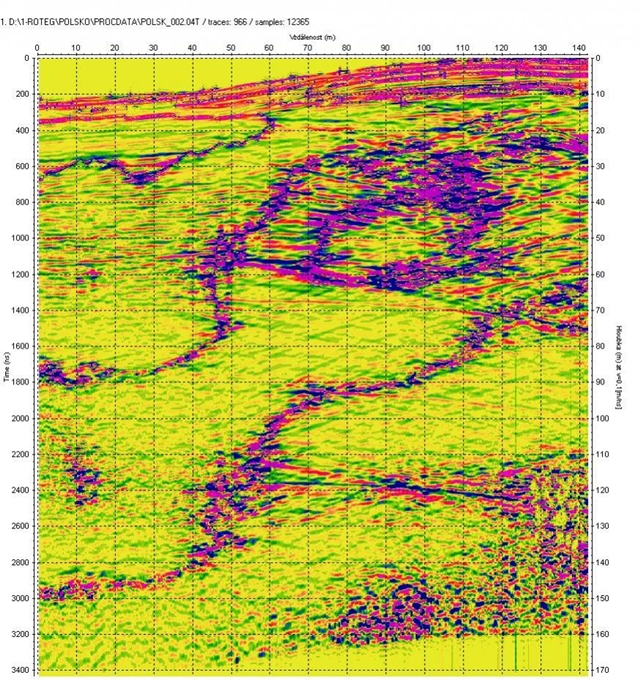
Below is the second profile, which was measured in parallel with the first, only 20 m further north. View to a depth of 160 m.
The structure of the reflections is similar, the blocks have different boundaries, we are at a break, so it can be expected. Isolines are not used here, the block boundaries are still easy to read.
It is important for us to conclude that with a more detailed data recording in Roteg together with the Reflex program, we see the subsoil structure to a depth of 3x greater than with the Loza – Krot combination.
Appendix 12/2020
The message in the link at the beginning of the article contains a drawing with profile 3. It is led perpendicular to the previous profile and a geological fault is captured on it. It is shown here after processing in the Spirio program in the low-frequency spectrum.
|