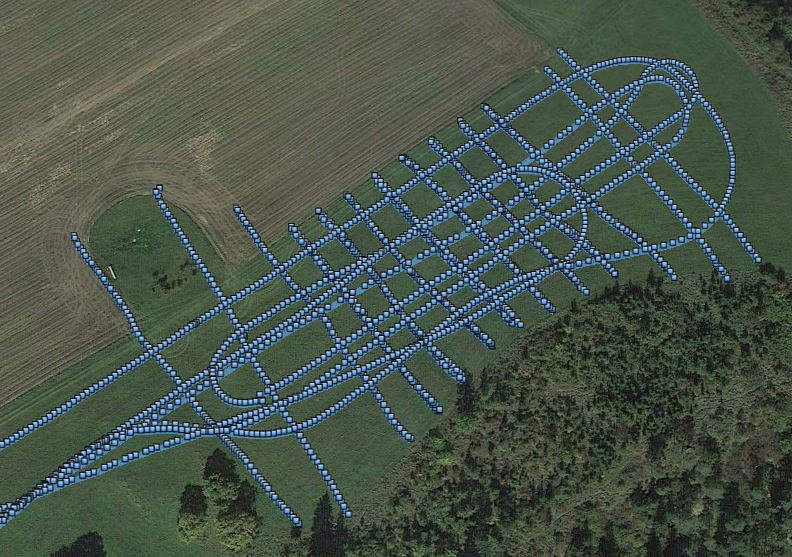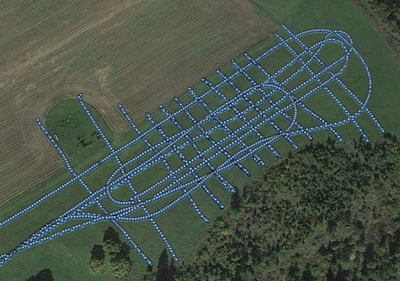
Blue dots illustrate the GPS points collected during the GPR measurement.
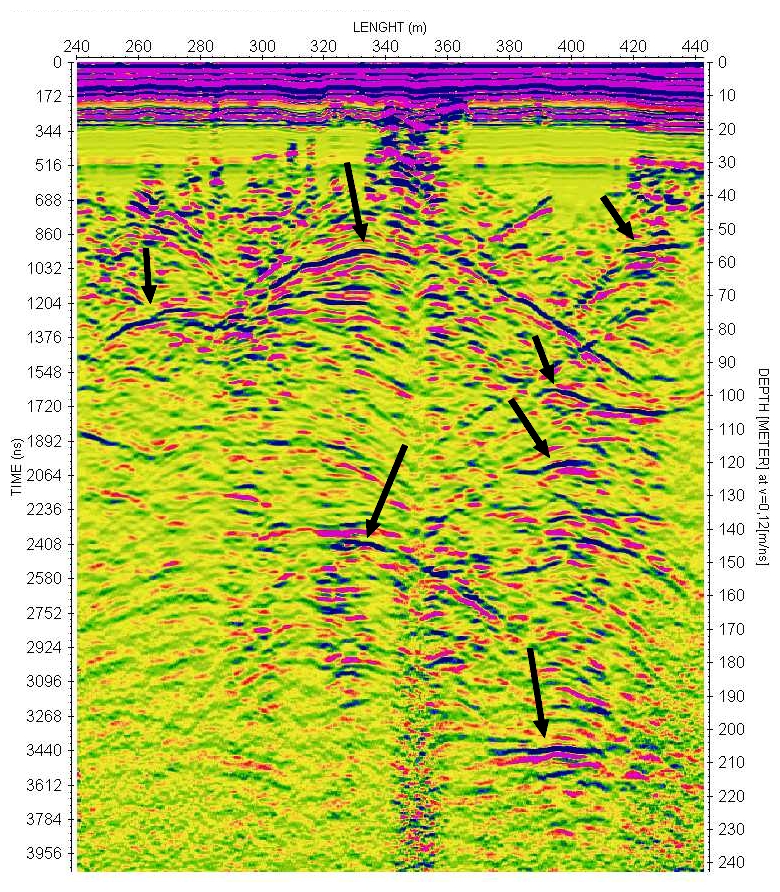
Long reflection in the hyperbolic shape with a vertex at a depth of 50 meters in the middle part of the radargram is probably a large cavity. A series of parallel profiles can give us an estimation of the size of the cavities, the orientations of the fissures and the positions of the corridors. Deepest continuous reflection is from a cavity in 230 m depth.
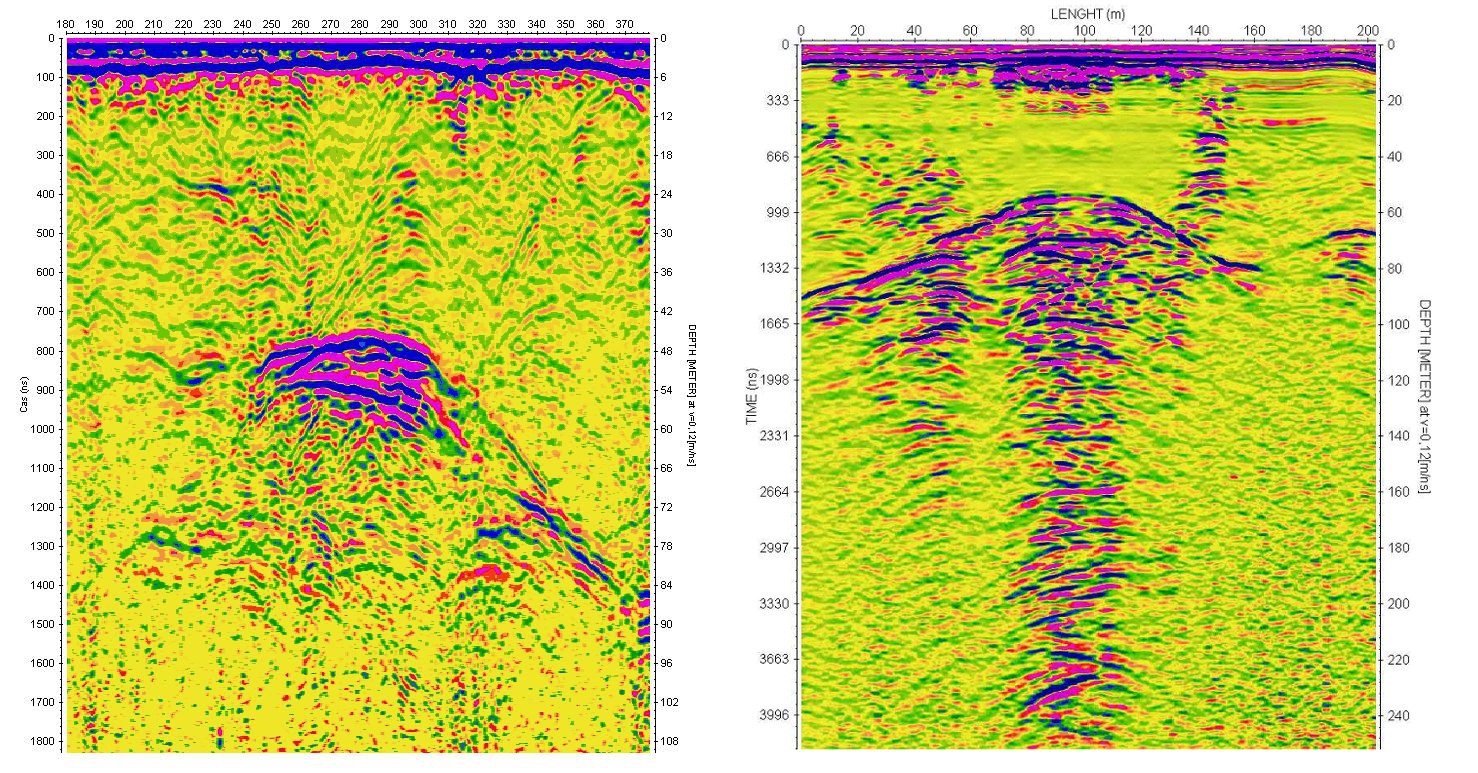
 Next profile detected another undiscovered cavity at a depth of 50-65 m. The spacing between sections is 25 m. Next profile detected another undiscovered cavity at a depth of 50-65 m. The spacing between sections is 25 m.
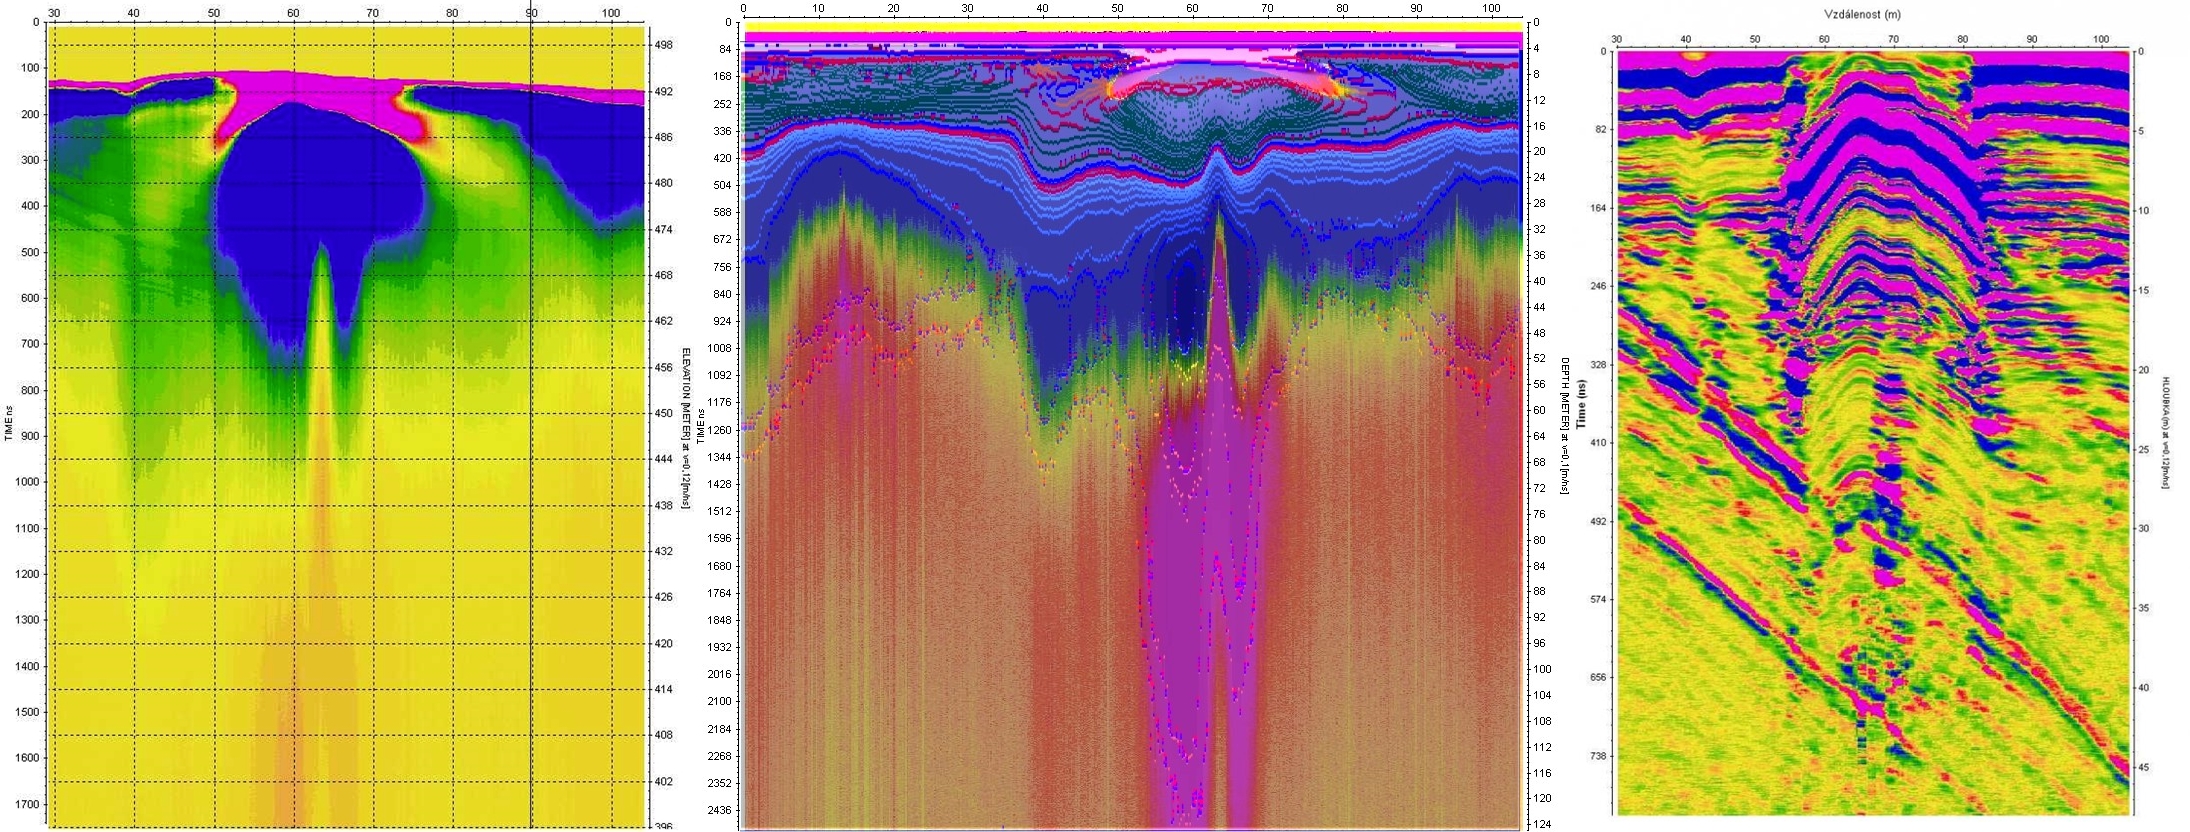
Surface cracks and its deposits
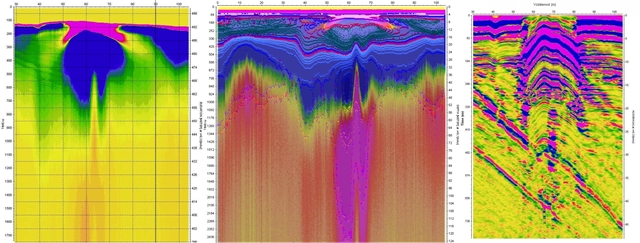 A view of monitor screen during measurement is on the left figure, basic method for data visualization. A view of monitor screen during measurement is on the left figure, basic method for data visualization.
A combination of visualizations in processing softwares Krot and ReflexW is on the middle figure.
A filtered section showing only the higher frequencies is on the right figure. It is easy to see the layering of the deposits, spherical layers are typical for cracks’ deposit from the Ice Age. This crack could be an easy entrance into the deep-located cavities.
Measurements confirmed that GPR can relatively easily and quickly explore a large area to a depth of around 250 m. It can also be estimated from the phase of the amplitudes whether the cavities are empty or filled.
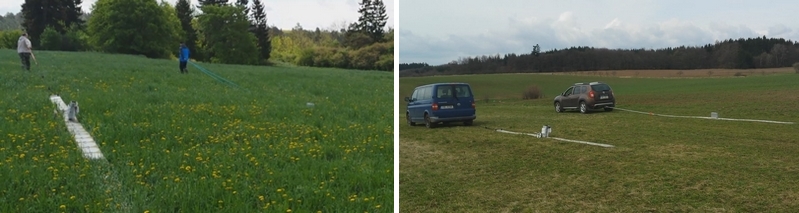
Measurement speed 8 km/h is sufficient to allow detailed measurements with 15 cm step. Length of the profiles can be stretched up to several tens of kilometres on a single battery charge (about 5 hours of measurement). A dry grassy surface is ideal for towing the antennas mounted on canvas. Flexible plastic plates can be added for measuring on rocky surfaces. Some 20 kilometres of profiles in 4 different locations were measured in only two afternoons.
|